Monitoring PHP-FPM Pools through Prometheus and Grafana on CentOS 6 and 7
Updated:
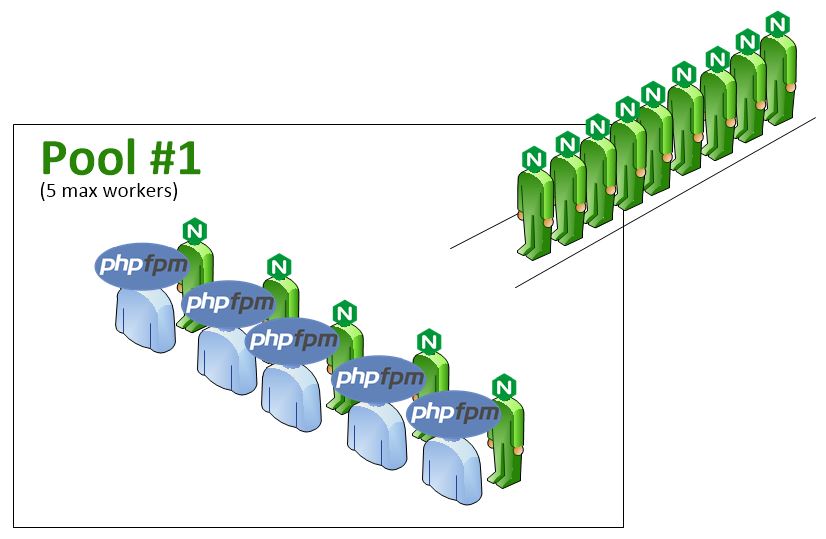
We are going to monitor metrics of our PHP-FPM pools through phpfpm_exporter and store those metrics on the Prometheus server and visualize it through Grafana. Here, fpm pools Metrics are scrapped via Unix socket and made it available on port 9253. This guide is for CentOS 6 and CentOS 7 server but can be followed on other distribution as well.
phpfpm_exporter » prometheus » grafana
The FPM status page must be enabled in every pool you’d like to monitor by defining the below line.
pm.status_path = /status
SAMPLE OF PHP-FPM POOL
vim /usr/local/php/etc/php-fpm.d/api.conf
[api]
user = nginx
group = nginx
listen.owner = nginx
listen.group = nginx
listen.mode = 0660
listen = /var/run/phpfpm-api1.sock
request_slowlog_timeout = 5s
slowlog = /var/log/php/php-slow.log
request_terminate_timeout = 120s
pm = dynamic
pm.max_children = 100
pm.start_servers = 10
pm.min_spare_servers =10
pm.max_spare_servers = 15
pm.max_requests = 500
listen.backlog = -1
pm.status_path = /status
rlimit_files = 131072
rlimit_core = unlimited
catch_workers_output = yes
env[HOSTNAME] = $HOSTNAME
php_flag[display_errors] = on
php_admin_flag[log_errors] = on
If you want to access your fpm pool status through your browser then you should add below entry in your Nginx configuration.
NGINX CONFIG
location ~ ^/(status|ping)$ {
        allow 127.0.0.1;
        deny all;
        fastcgi_param SCRIPT_FILENAME $document_root$fastcgi_script_name;
        fastcgi_index index.php;
        include fastcgi_params;
        fastcgi_pass   unix:/var/run/phpfpm-api.sock;
}
Now reload nginx service but before that check your nginx configuration.
nginx -t
service nginx reload
PHP-FPM STATUS
Check PHP-FPM status:
https://bdn.com.np/status
pool: api
process manager: dynamic
start time: 14/Aug/2020:01:28:03 +0545
start since: 243956
accepted conn: 14617
listen queue: 0
max listen queue: 0
listen queue len: 0
idle processes: 7
active processes: 1
total processes: 8
max active processes: 4
max children reached: 0
slow requests: 0
Below is meaning of different values:
pool – the name of the pool. In my case it’s pool api.
process manager – possible values static, dynamic or ondemand.
start time – the date and time FPM has started or reloaded. Reloading PHP-FPM (service php5-fpm reload) reset this value.
start since – number of seconds since FPM has started
accepted conn – the number of requests accepted by the pool
listen queue – the number of requests in the queue of pending connections. If this number is non-zero, then you better increase the number of processes FPM can spawn.
max listen queue – the maximum number of requests in the queue of pending connections since FPM has started.
listen queue len – the size of the socket queue of pending connections.
idle processes – the number of idle processes.
active processes – the number of active processes.
total processes – the number of idle + active processes.
max active processes – the maximum number of active processes since FPM has started.
max children reached – number of times, the process limit has been reached when pm tries to start more children. If that value is not zero, then you may need to increase the max process limit for your PHP-FPM pool.
slow requests – Enable PHP-FPM slow-log before you consider this. If this value is non-zero you may have slow PHP processes. Poorly written MySQL queries are generally the culprit.
CHOOSE RIGHT PROCESS MANAGER:
Which Process manager is right for you?
The answer is: "it depends", as it always depends on the type of applications that you are running.
- static
- dynamic
- ondemand
STATIC
Static ensures a fixed number of child processes are always available to handle user requests. This is set with pm.max_children. In this mode, requests don’t need to wait for new processes to startup, which makes it the fastest approach.
vim /usr/local/php/etc/php-fpm.d/api.conf
pm = static
pm.max_children = 10
DYNAMIC
In this mode, PHP-FPM dynamically manages the number of available child processes and ensures that at least one child process is always available. This configuration uses five configuration options; these are:
pm.max_children: The maximum number of child processes allowed to be spawned.
pm.start_servers: The number of child processes to start when PHP-FPM starts.
pm.min_spare_servers: The minimum number of idle child processes PHP-FPM will create. More are created if fewer than this number are available.
pm.max_spare_servers: The maximum number of idle child processes PHP-FPM will create. If there are more child processes available than this value, then some will be killed off.
pm.process_idle_timeout: The idle time, in seconds, after which a child process will be killed.
vim /usr/local/php/etc/php-fpm.d/api.conf
pm = dynamic
pm.max_children = 100
pm.start_servers = 32
pm.min_spare_servers = 16
pm.max_spare_servers = 32
pm.max_requests = 200
pm.process_idle_timeout = 12s
ONDEMAND
ondemand has PHP-FPM fork processes when requests are received. To configure PHP-FPM to use it, we need to set pm to dynamic, and provide values for:
max_children
process_idle_timeout
max_requests
max_requests sets the number of requests each child process should execute before respawning. The documentation suggests that this setting is helpful for working around memory leaks.
vim /usr/local/php/etc/php-fpm.d/api.conf
pm = ondemand
pm.max_children = 100
pm.process_idle_timeout = 10s
pm.max_requests = 200
Now, follow the below steps to scrape metrics from your PHP-FPM Unix socket. Later it will be made available on port 9253. For this, I’ve used a phpfpm exporter from Lusitaniae. https://github.com/Lusitaniae/phpfpm_exporter
wget https://github.com/Lusitaniae/phpfpm_exporter/releases/download/v0.5.0/phpfpm_exporter-0.5.0.linux-amd64.tar.gz
tar xvf phpfpm_exporter-0.5.0.linux-amd64.tar.gz
cp phpfpm_exporter-0.5.0.linux-amd64/phpfpm_exporter /usr/local/bin/
Now, list out all the fpm socket you have been running on your system which you want to monitor. for that, you can execute the below command.
grep -ri "sock;" /etc/nginx/* | grep -v "#" |awk '{print $2,$3,$4}' | sed 's/fastcgi_pass unix://g' | sed 's/;//g' | sort -u
Now create init script and systemd file mentioning all the fpm sockets. In my case, I’ve 2 api PHP-FPM sockets.
START-UP CONFIG
SYSTEMD FILE
For CentOS 7: Create Systemd Service.
vim /etc/systemd/system/phpfpm_exporter.service
[Unit]
Description = PHP-FPM Prometheus Exporter

[Service]
SyslogIdentifier = phpfpm_exporter

ExecStart =/usr/local/bin/phpfpm_exporter --phpfpm.socket-paths /var/run/phpfpm-api1.sock --phpfpm.socket-paths /var/run/phpfpm-api2-sock


[Install]
WantedBy = multi-user.target
systemctl start phpfpm_exporter
systemctl enable phpfpm_exporter
For CentOS 6: Create init script.
INIT.D SCRIPT
vim /etc/init.d/phpfpm_exporter
#!/bin/sh -e
# Phpfpm exporter startup script
#Ref: https://github.com/Lusitaniae/phpfpm_exporter
# chkconfig: - 64 36
#description: phpfpm_exporter


# Define some variables
APP=phpfpm_exporter
# Location of phpfpm_exporter binary
PHPFPM_EXP=/usr/local/bin
QUERY="--phpfpm.socket-paths /var/run/phpfpm-api1.sock --phpfpm.socket-paths /var/run/phpfpm-api2-sock "


case "$1" in
  # Start command
  start)
    echo "Starting $APP"
        nohup $PHPFPM_EXP/phpfpm_exporter $QUERY > /dev/null 2>&1&
        echo $! > /var/run/phpfpm_exporter.pid
        echo
   ;;
  # Stop command
  stop)
    echo "Stopping $APP"
        if [ -f /var/run/phpfpm_exporter.pid ]; then
        kill `cat /var/run/phpfpm_exporter.pid`
        rm /var/run/phpfpm_exporter.pid
        fi
    echo "$APP stopped successfully"
    ;;
   # Restart command
   restart)
        $0 stop
        sleep 5
        $0 start
        ;;
  *)
    echo "Usage: /etc/init.d/$APP {start|restart|stop}"
    exit 1
    ;;
esac

exit 0
Make the script executable and autostart during boot.
chmod +x /etc/init.d/phpfpm_exporter
chkconfig --add phpfpm_exporter
chkconfig phpfpm_exporter on
By default, phpfpm_exporter service will listen on port 9253
PROMETHEUS
Add a new job in the Prometheus configuration with the required parameters. Here, we are scrapping PHP fpm pool metrics from two servers. srv-01.bdn.com.np and srv-02.bdn.com.np through Port 9253.
vim /etc/prometheus/prometheus.yml
  - job_name: phpfpm
    scrape_interval: 60s
    scrape_timeout: 30s
    static_configs:
    - targets: ['srv-01.bdn.com.np:9253', 'srv-02.bdn.com.np:9253']
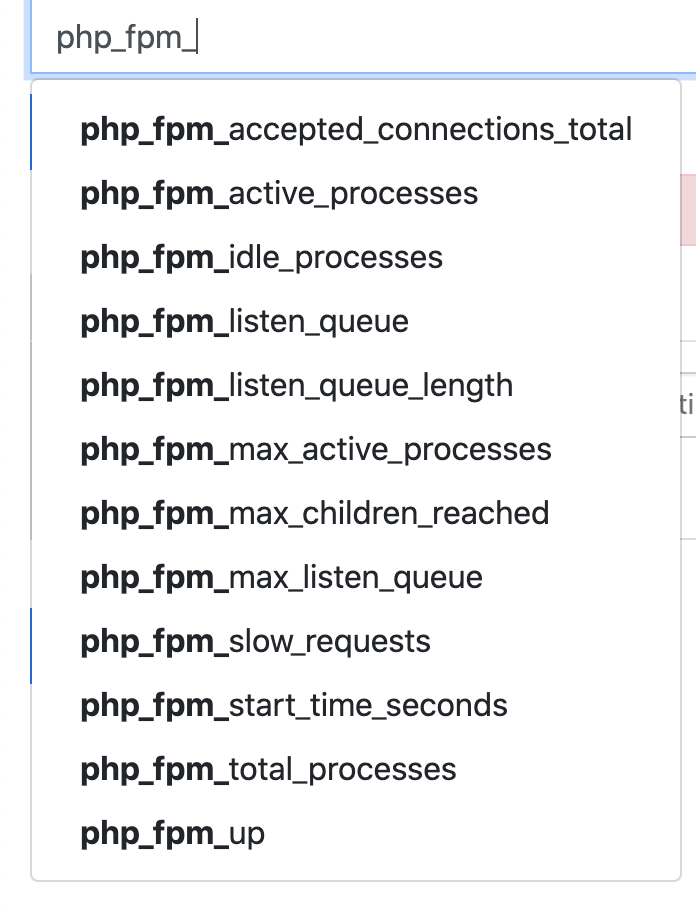
You can see the pool metrics emitted by the PHP-fpm exporter from your Prometheus URL. http://monitoring.bdn.com.np:9090
GRAFANA
DASHBOARD

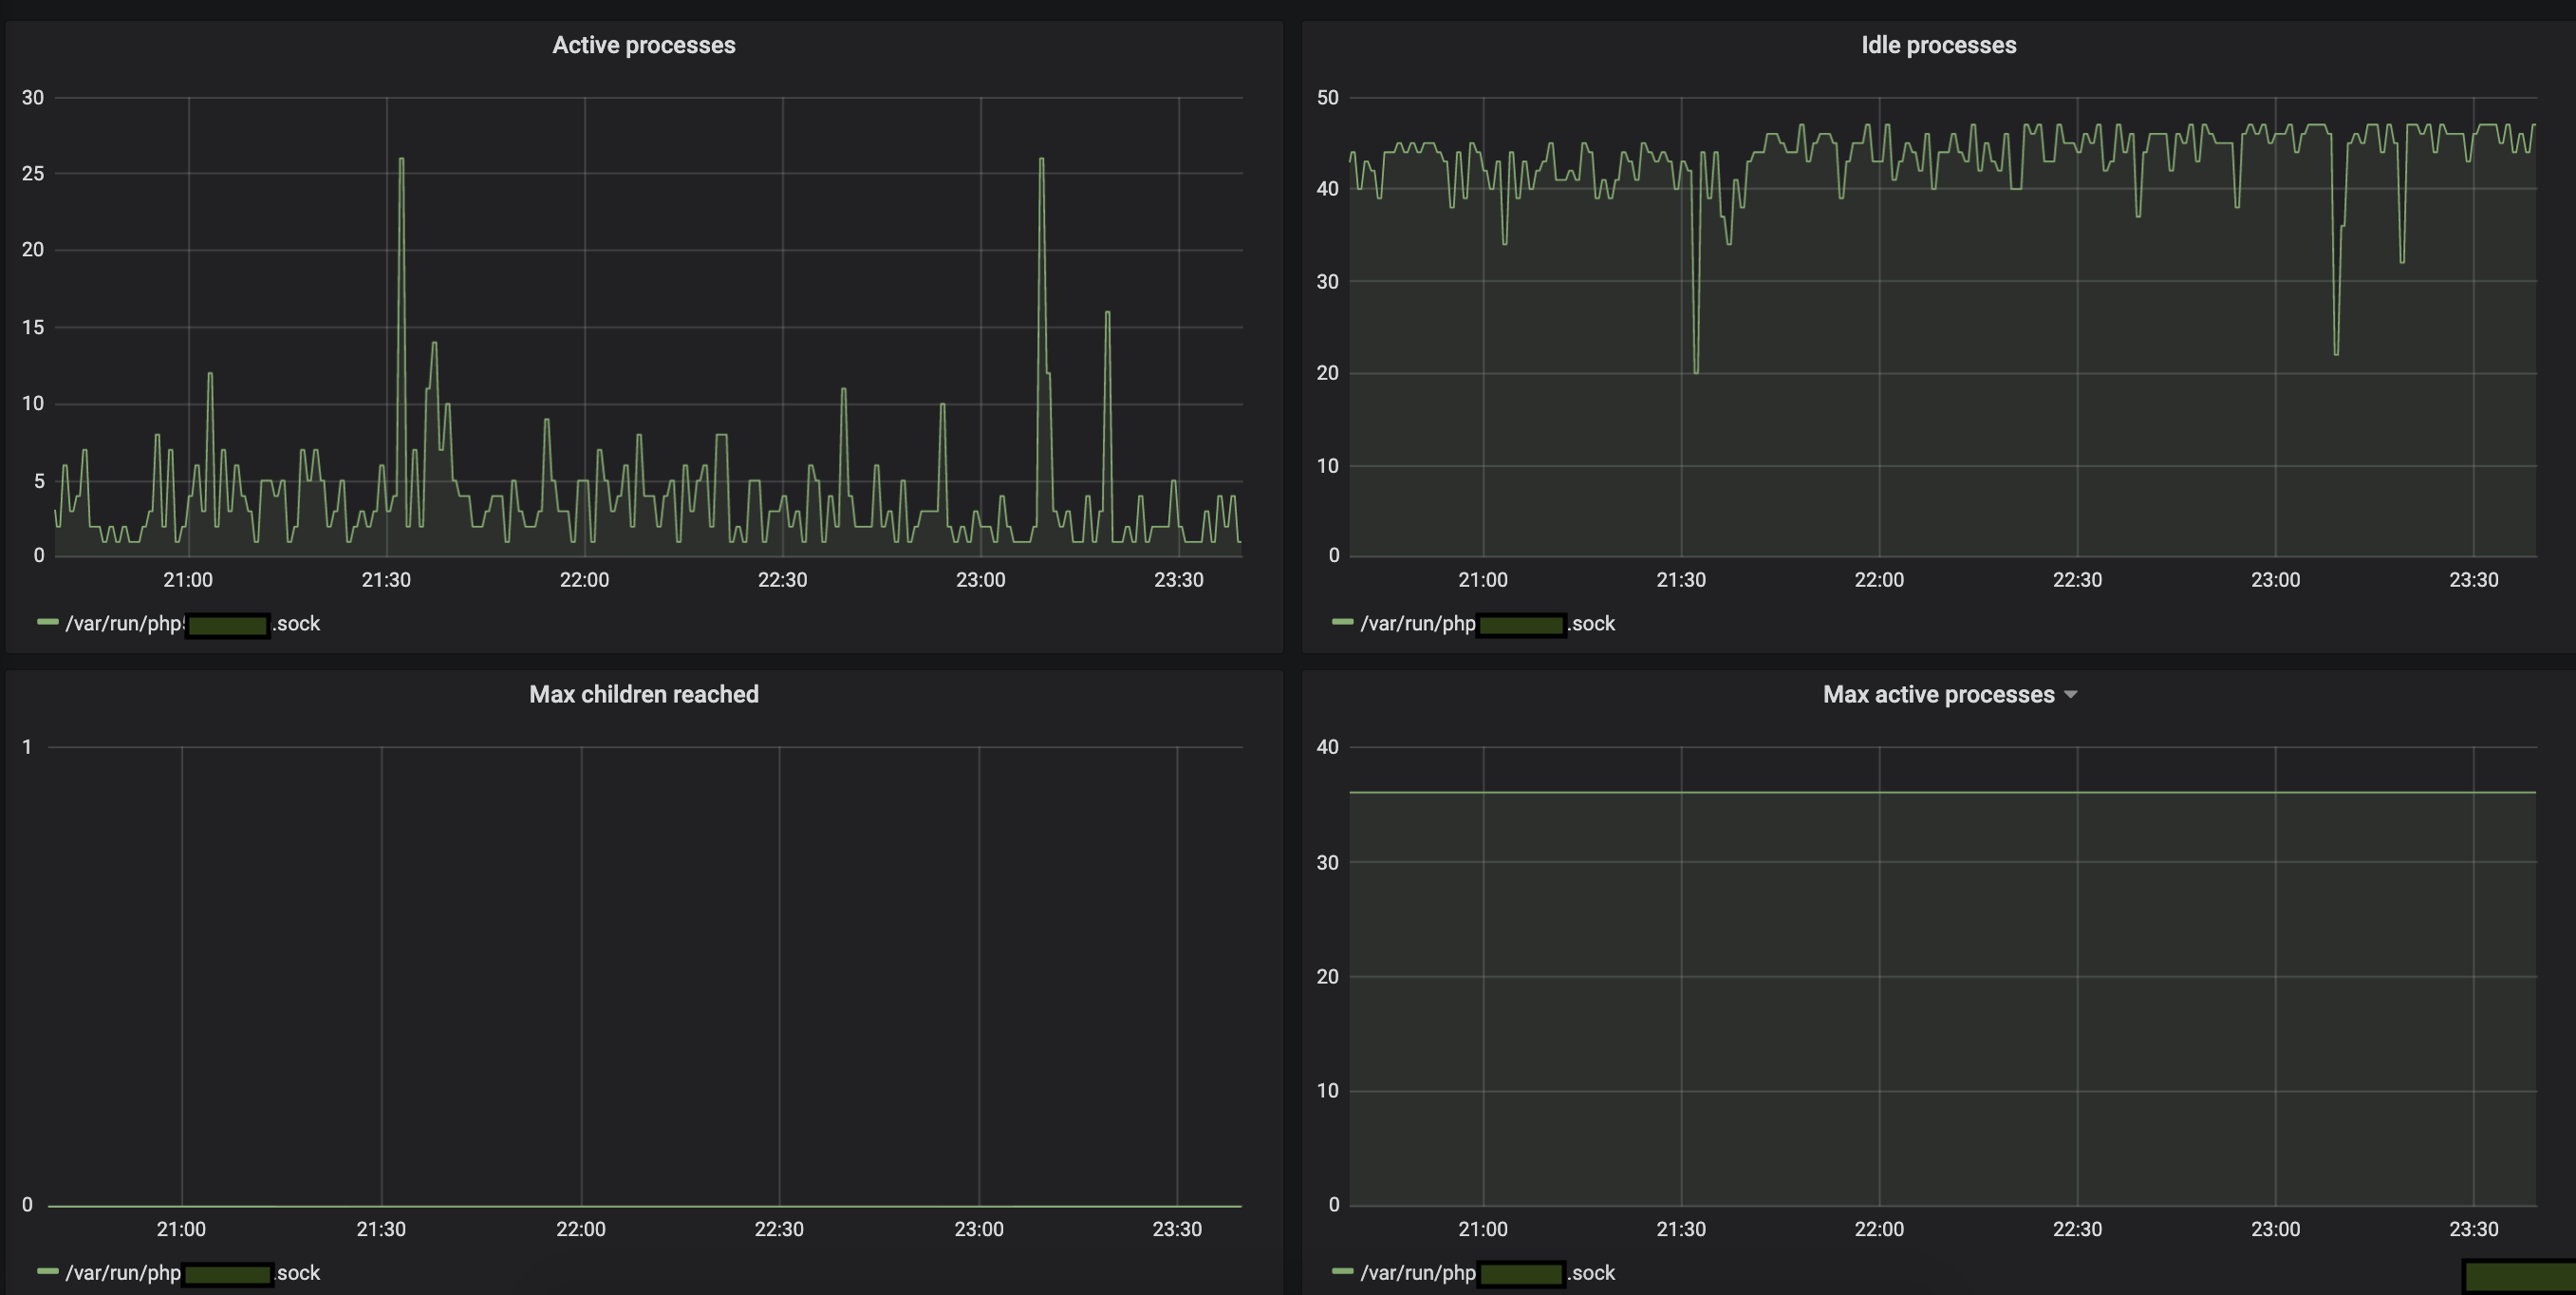
Here is my Grafana dashboard for PHP-FPM multipool. I’ve used PHP-FPM Multi Pool Grafana Dashboard by Lusitaniae but I’ve customized the dashboard according to my case.
To download the original dashboard: Click here
To download my modified dashboard: Click here
Download the JSON file and Import it in Grafana.


Leave a comment