OpenLDAP Monitoring - Nagios, Cacti and OpenLDAP Exporter
Updated:
We are going to monitor OpenLDAP in our CentOS and Ubuntu servers. After that, we will be able to get an alert from Nagios and also visualize it through Cacti and Grafana.
Slapd supports an optional LDAP monitoring interface you can use to obtain information regarding the current state of your slapd instance. For instance, the interface allows you to determine how many clients are connected to the server currently, uptime, operations etc. The monitoring information is provided by a specialized backend, the monitor backend. When the monitoring interface is enabled, LDAP clients may be used to access information provided by the monitor backend, subject to access and other controls.
Monitoring setup
In CentOS monitor backend module is loaded by default so we don’t not to load it again but in Ubuntu we need to load monitor module first.
Check if your monitoring module is enabled on your OpenLDAP installation.
ldapsearch -Y EXTERNAL -H ldapi:/// -b "cn=module{0},cn=config"
To enable the monitoring module, create a module_monitoring.ldif file and run the command:
vim module_monitoring.ldif
dn: cn=module{0},cn=config
changetype: modify
add: olcModuleLoad
olcModuleLoad: {2}back_monitor
ldapmodify -Y EXTERNAL -H ldapi:/// -f module_monitoring.ldif
Verify newly added module listed or not.
root@srv-01:~# ldapsearch -Y EXTERNAL -H ldapi:/// -b "cn=module{0},cn=config"
SASL/EXTERNAL authentication started
SASL username: gidNumber=0+uidNumber=0,cn=peercred,cn=external,cn=auth
SASL SSF: 0
# extended LDIF
#
# LDAPv3
# base <cn=module{0},cn=config> with scope subtree
# filter: (objectclass=*)
# requesting: ALL
#

# module{0}, config
dn: cn=module{0},cn=config
objectClass: olcModuleList
cn: module{0}
olcModulePath: /usr/lib/ldap
olcModuleLoad: {0}back_mdb
olcModuleLoad: {1}syncprov.la
olcModuleLoad: {2}back_monitor

# search result
search: 2
result: 0 Success

# numResponses: 2
# numEntries: 1
Now setup monitor database. Also, allow monitoring information accessible to only user admin here. You can also create a different user to allow access for that user only to monitoring information.
vim db_monitor.ldif
dn: olcDatabase={2}Monitor,cn=config
objectClass: olcDatabaseConfig
objectClass: olcMonitorConfig
olcDatabase: {2}Monitor
olcAccess: {0}to * by dn.base="gidNumber=0+uidNumber=0,cn=peercred,cn=external, cn=auth" read by dn.base="cn=admin,dc=bidhankhatri,dc=com,dc=np" read by * none
For CentOS, define like below.
vim db_monitor.ldif
dn: olcDatabase={1}monitor,cn=config
changetype: modify
replace: olcAccess
olcAccess: {0}to * by dn.base="gidNumber=0+uidNumber=0,cn=peercred,cn=external, cn=auth" read by dn.base="cn=admin,dc=bidhankhatri,dc=com,dc=np" read by * none
Now add it to the database.
ldapadd -Y EXTERNAL -H ldapi:/// -f db_monitor.ldif
you can verify now by executing below command to verify uptime of slapd.
root@srv-01:~# ldapsearch -x -D "cn=admin,dc=bidhankhatri,dc=com,dc=np" -W -b cn=Uptime,cn=Time,cn=Monitor -s base '(objectClass=*)' '*' '+'
Enter LDAP Password:
# extended LDIF
#
# LDAPv3
# base <cn=Uptime,cn=Time,cn=Monitor> with scope baseObject
# filter: (objectClass=*)
# requesting: * +
#

# Uptime, Time, Monitor
dn: cn=Uptime,cn=Time,cn=Monitor
objectClass: monitoredObject
structuralObjectClass: monitoredObject
cn: Uptime
creatorsName:
modifiersName:
createTimestamp: 20210430090257Z
modifyTimestamp: 20210430090257Z
monitoredInfo: 333608
entryDN: cn=Uptime,cn=Time,cn=Monitor
subschemaSubentry: cn=Subschema
hasSubordinates: FALSE

# search result
search: 2
result: 0 Success

# numResponses: 2
# numEntries: 1
Alert and Visualization
I guess you have already setup Nagios, Cacti, Prometheus and Grafana in your end.
Here are nice Cacti and Nagios Plugins to monitor your slapd instance. Have a look and go through the documentation and configure it. Plugins are written in perl. Some additional perl modules need to be pre-installed. Look into it. There are lot’s of plugins which you might be interested so go through the link.
https://ltb-project.org/documentation#monitoring
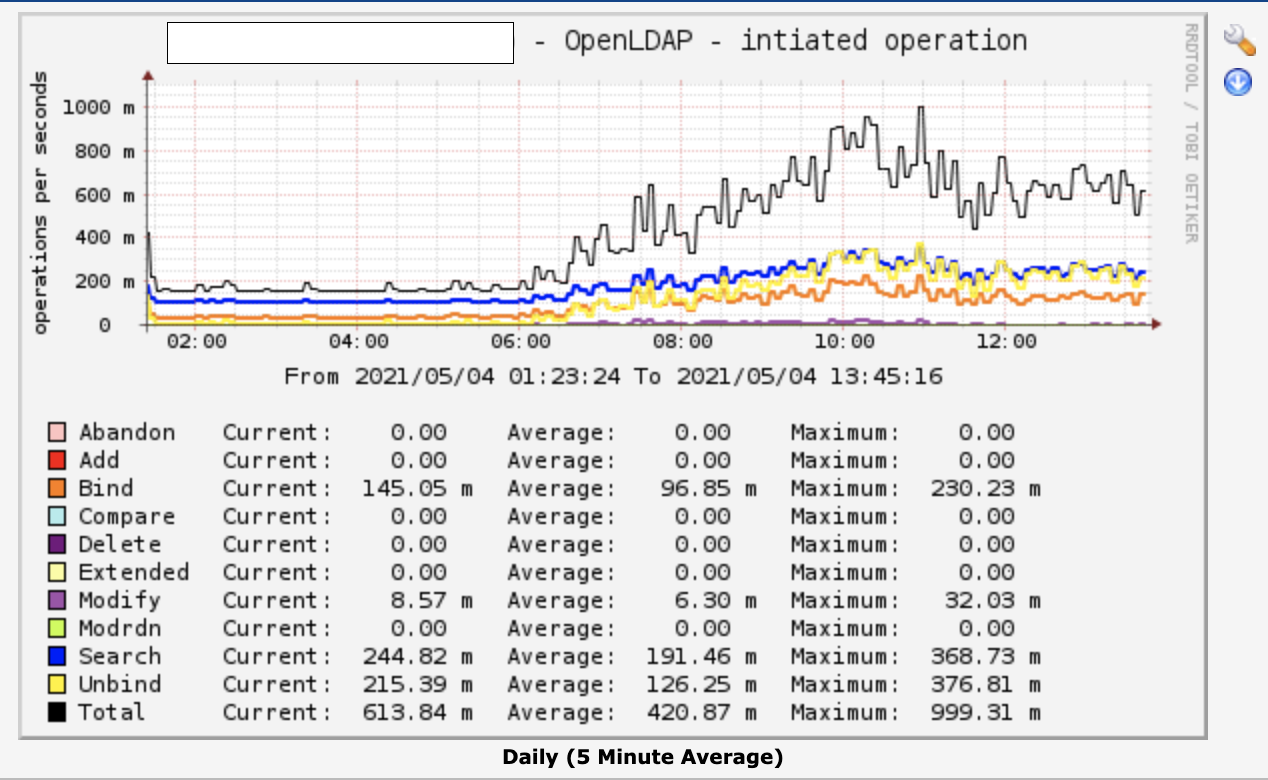
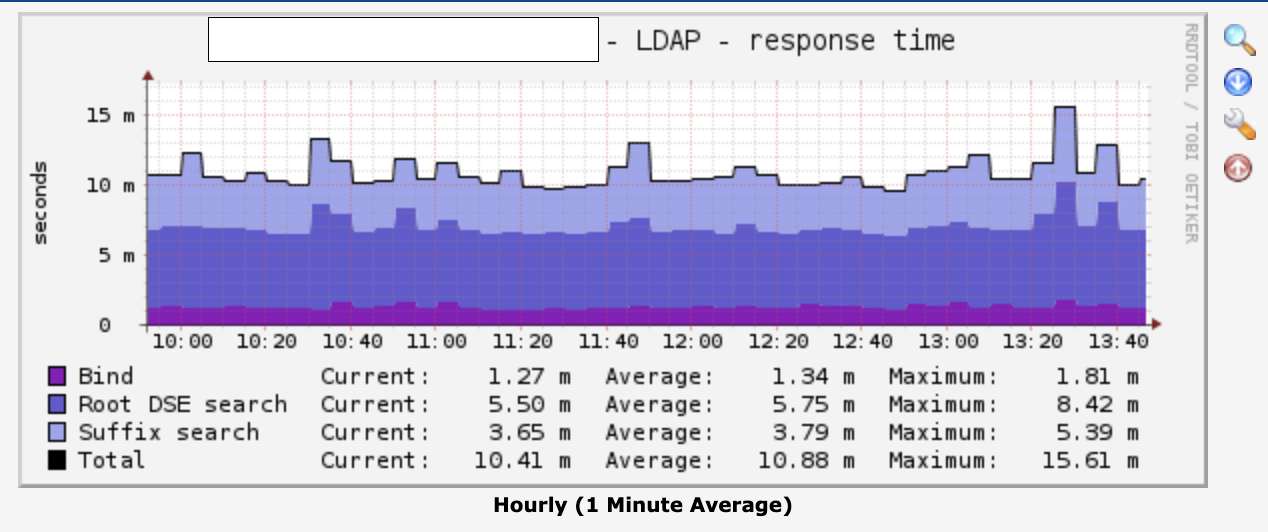
Nagios: Monitoring OpenLDAP Port, Response Time and Syncrepl status.

Cacti: OpenLDAP Operation and graph of Response Time.
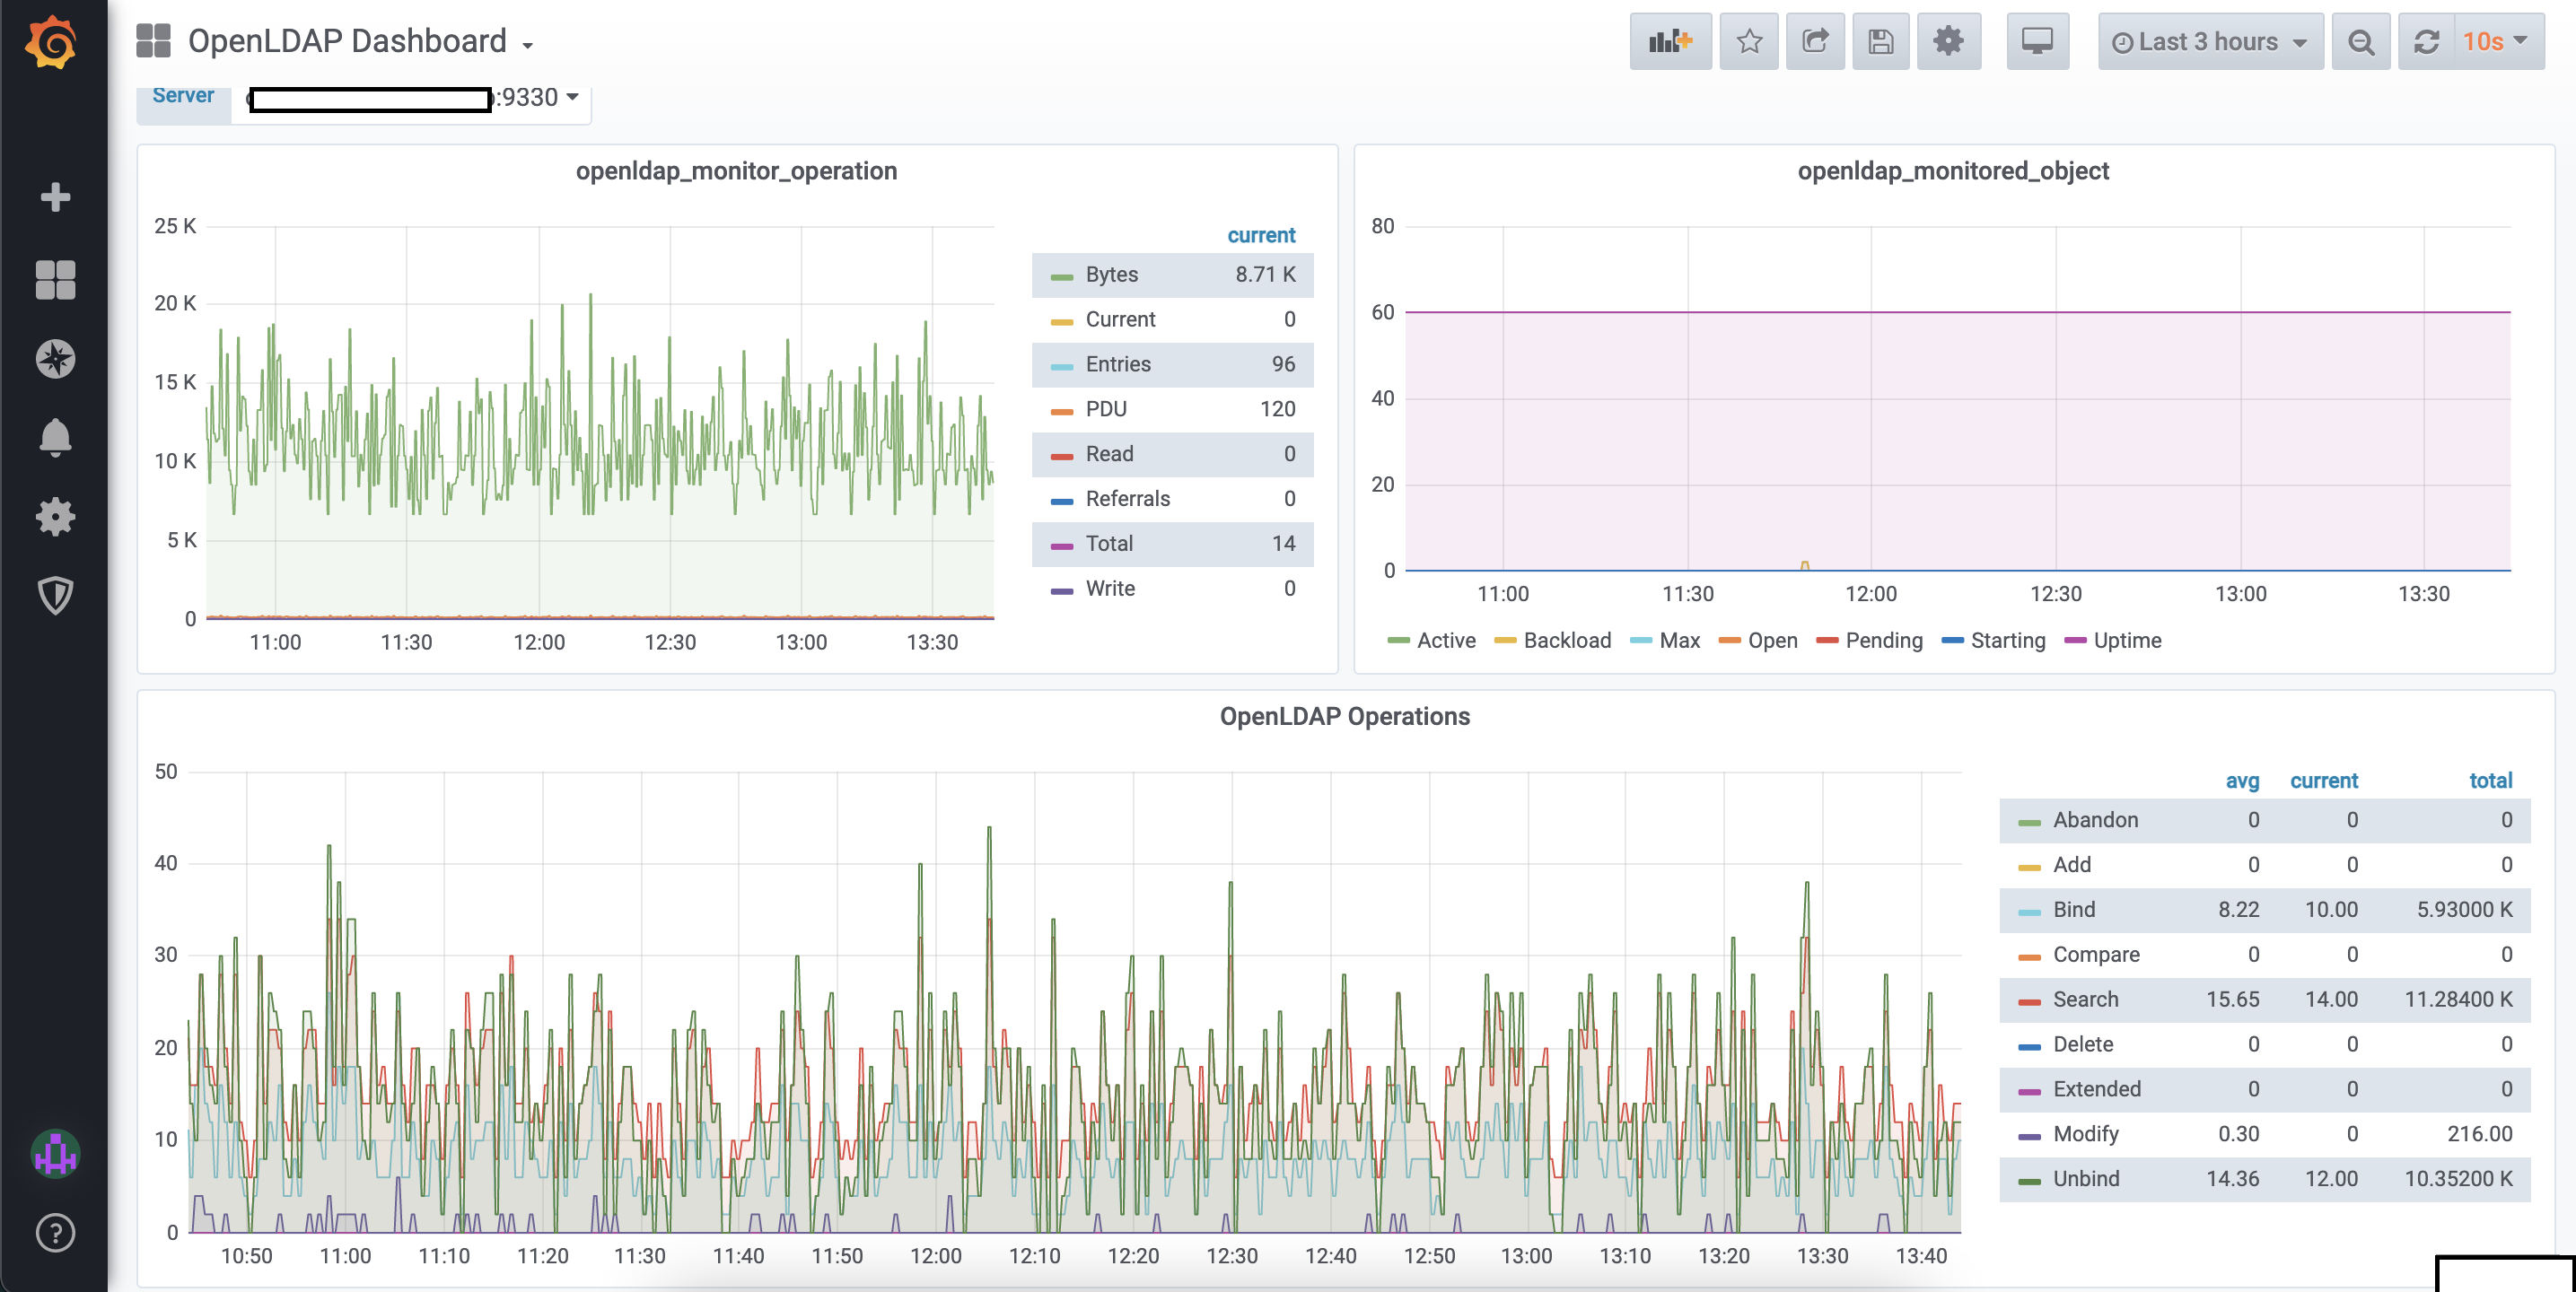
OpenLDAP Prometheus Exporter
If you want to visualize it through grafana then there is a OpenLDAP Prometheus Exporter available through which you can collect monitoring metrics. pipeline will be node exporter to prometheus to grafana. This is a simple service that scrapes metrics from OpenLDAP and exports them via HTTP for Prometheus consumption.
Download OpenLDAP Prometheus Exporter
wget https://github.com/tomcz/openldap_exporter/releases/download/v2.1/openldap_exporter-linux
mv openldap_exporter-linux /usr/local/bin/openldap_exporter
chmod +x /usr/local/bin/openldap_exporter
Define as a systemd file and mention User and Password.
vim /etc/systemd/system/openldap_exporter.service
# https://github.com/tomcz/openldap_exporter

Wants=network-online.target
After=network-online.target

[Service]
User=root
ExecStart=/usr/local/bin/openldap_exporter --ldapUser "cn=admin,dc=bidhankhatri,dc=com,dc=np" --ldapPass "helloworld"

[Install]
WantedBy=default.target
systemctl start openldap_exporter
systemctl enable openldap_exporter
In Prometheus end define below lines.
vim /etc/prometheus/prometheus.yml
  - job_name: openldap
    scrape_interval: 30s
    scrape_timeout: 10s
    static_configs:
    - targets: ['srv-01.bidhankhatri.com.np:9330','srv-02.bidhankhatri.com.np:9330']
systemctl restart prometheus
After collecting metrics from OpenLDAP you can make graph and visualize it through Grafana.


Leave a comment