Windows Machine Monitoring - Exchange, AD, DNS
Updated:
If you are a system administrator, you might have to monitor Windows PC’s, Exchange Server, Active Directory and DNS Server. For this tutorial, I am using windows exporter which is a Prometheus exporter to monitor our Windows Machines.

How Prometheus works
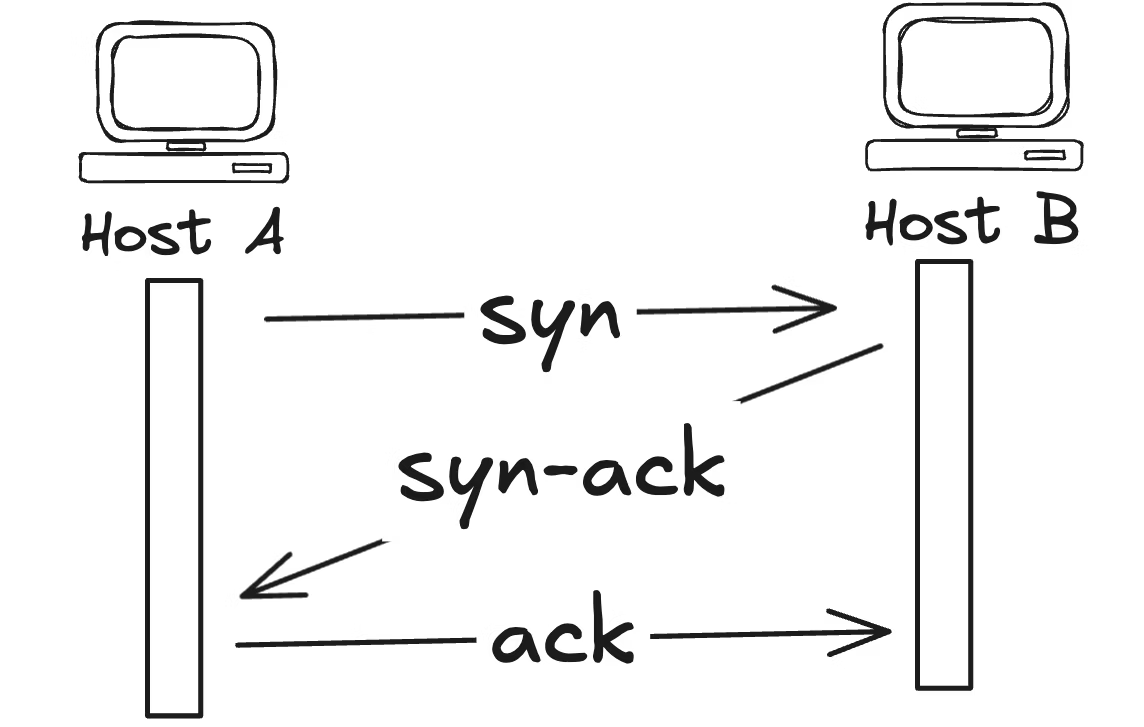
Prometheus scrapes metrics from instrumented jobs, either directly or via an intermediary push gateway for short-lived jobs. It stores all scraped samples locally and runs rules over this data to either aggregate and record new time series from existing data or generate alerts.
Install Windows Exporter
Download Windows Exporter MSI file.
https://github.com/prometheus-community/windows_exporter
Install Windows exporter. This msi file will create a windows_exporter service file too.
To verify:
Type win + R
services.msc
search for keyword ‘w’. You will find service name called “windows_exporter.”
Make sure this service is running. It will also automatically add firewall rule by opening TCP Port 9182. Allow only your Prometheus server IP in that rule.
Now your exporter is running, it will start exposing windows metrics on http://localhost:9182/metrics.
Open your web browser and navigate to the above URL. This is what you should see in your web browser.
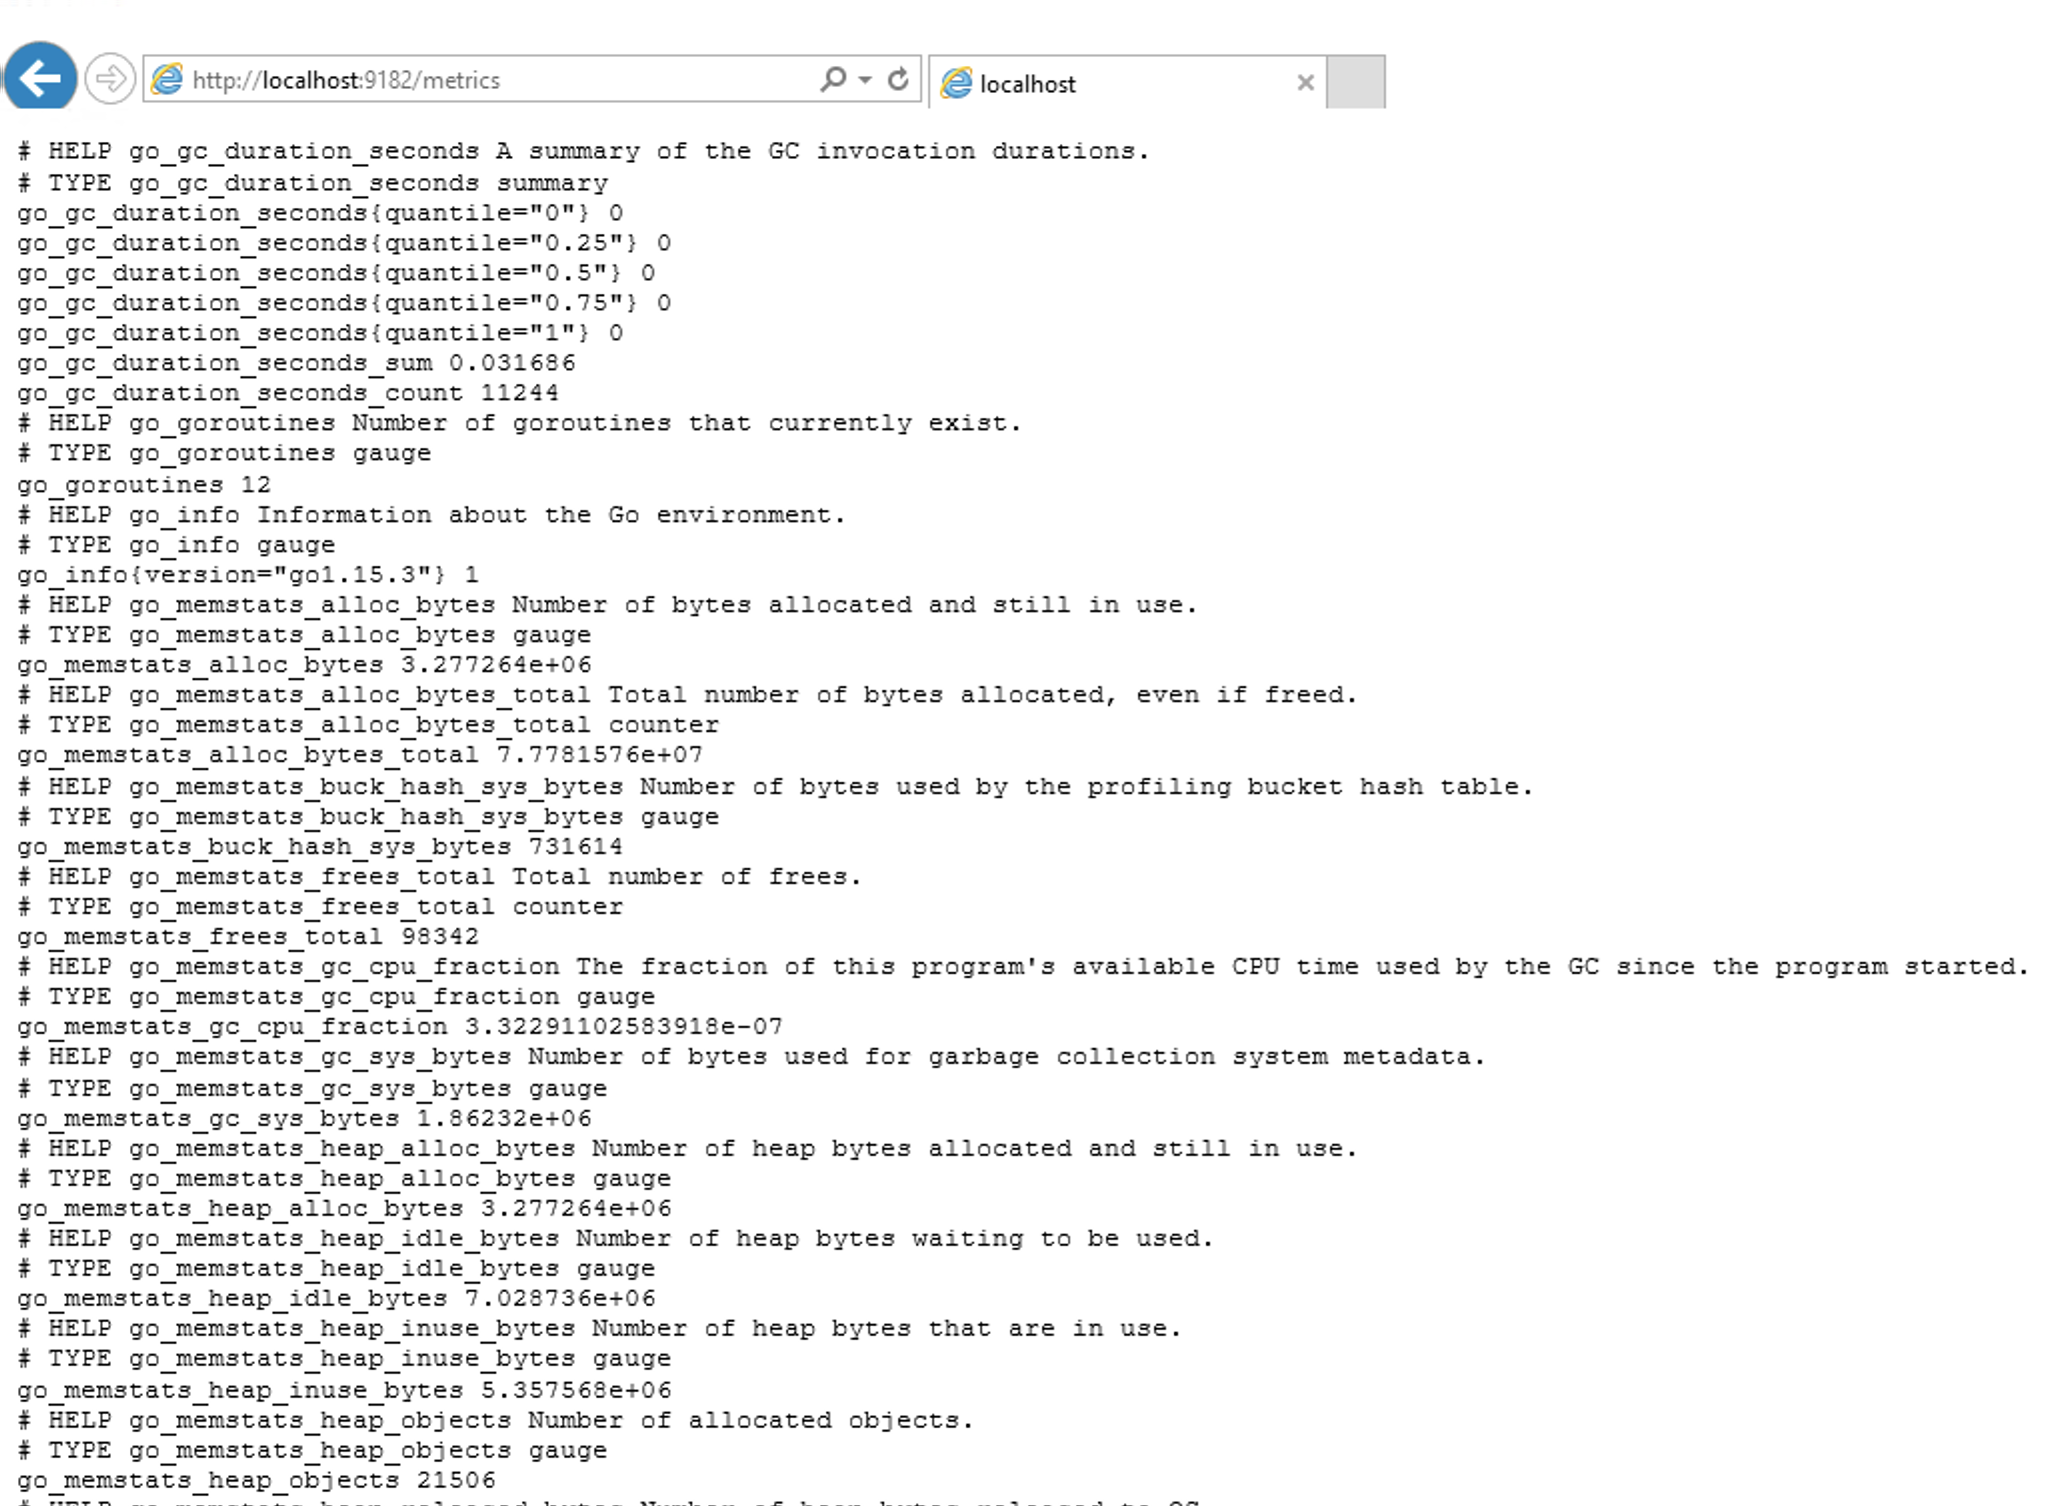
By default only few collectors “cpu, cs, logical_disk, net, os, service, system, textfile” are enabled. If you want to monitor like “exchange, ad, dns” then you should manually enable that collectors.
Two ways to enable collectors:
- Change through regedit directly
- Change through sc windows command
Here, I am going to show both ways to enable collectors. In some older windows versions like in windows 2008 you will not find service name “windows_exporter” through regedit process. In that case go through process 2.
Enable Collectors AD,DNS
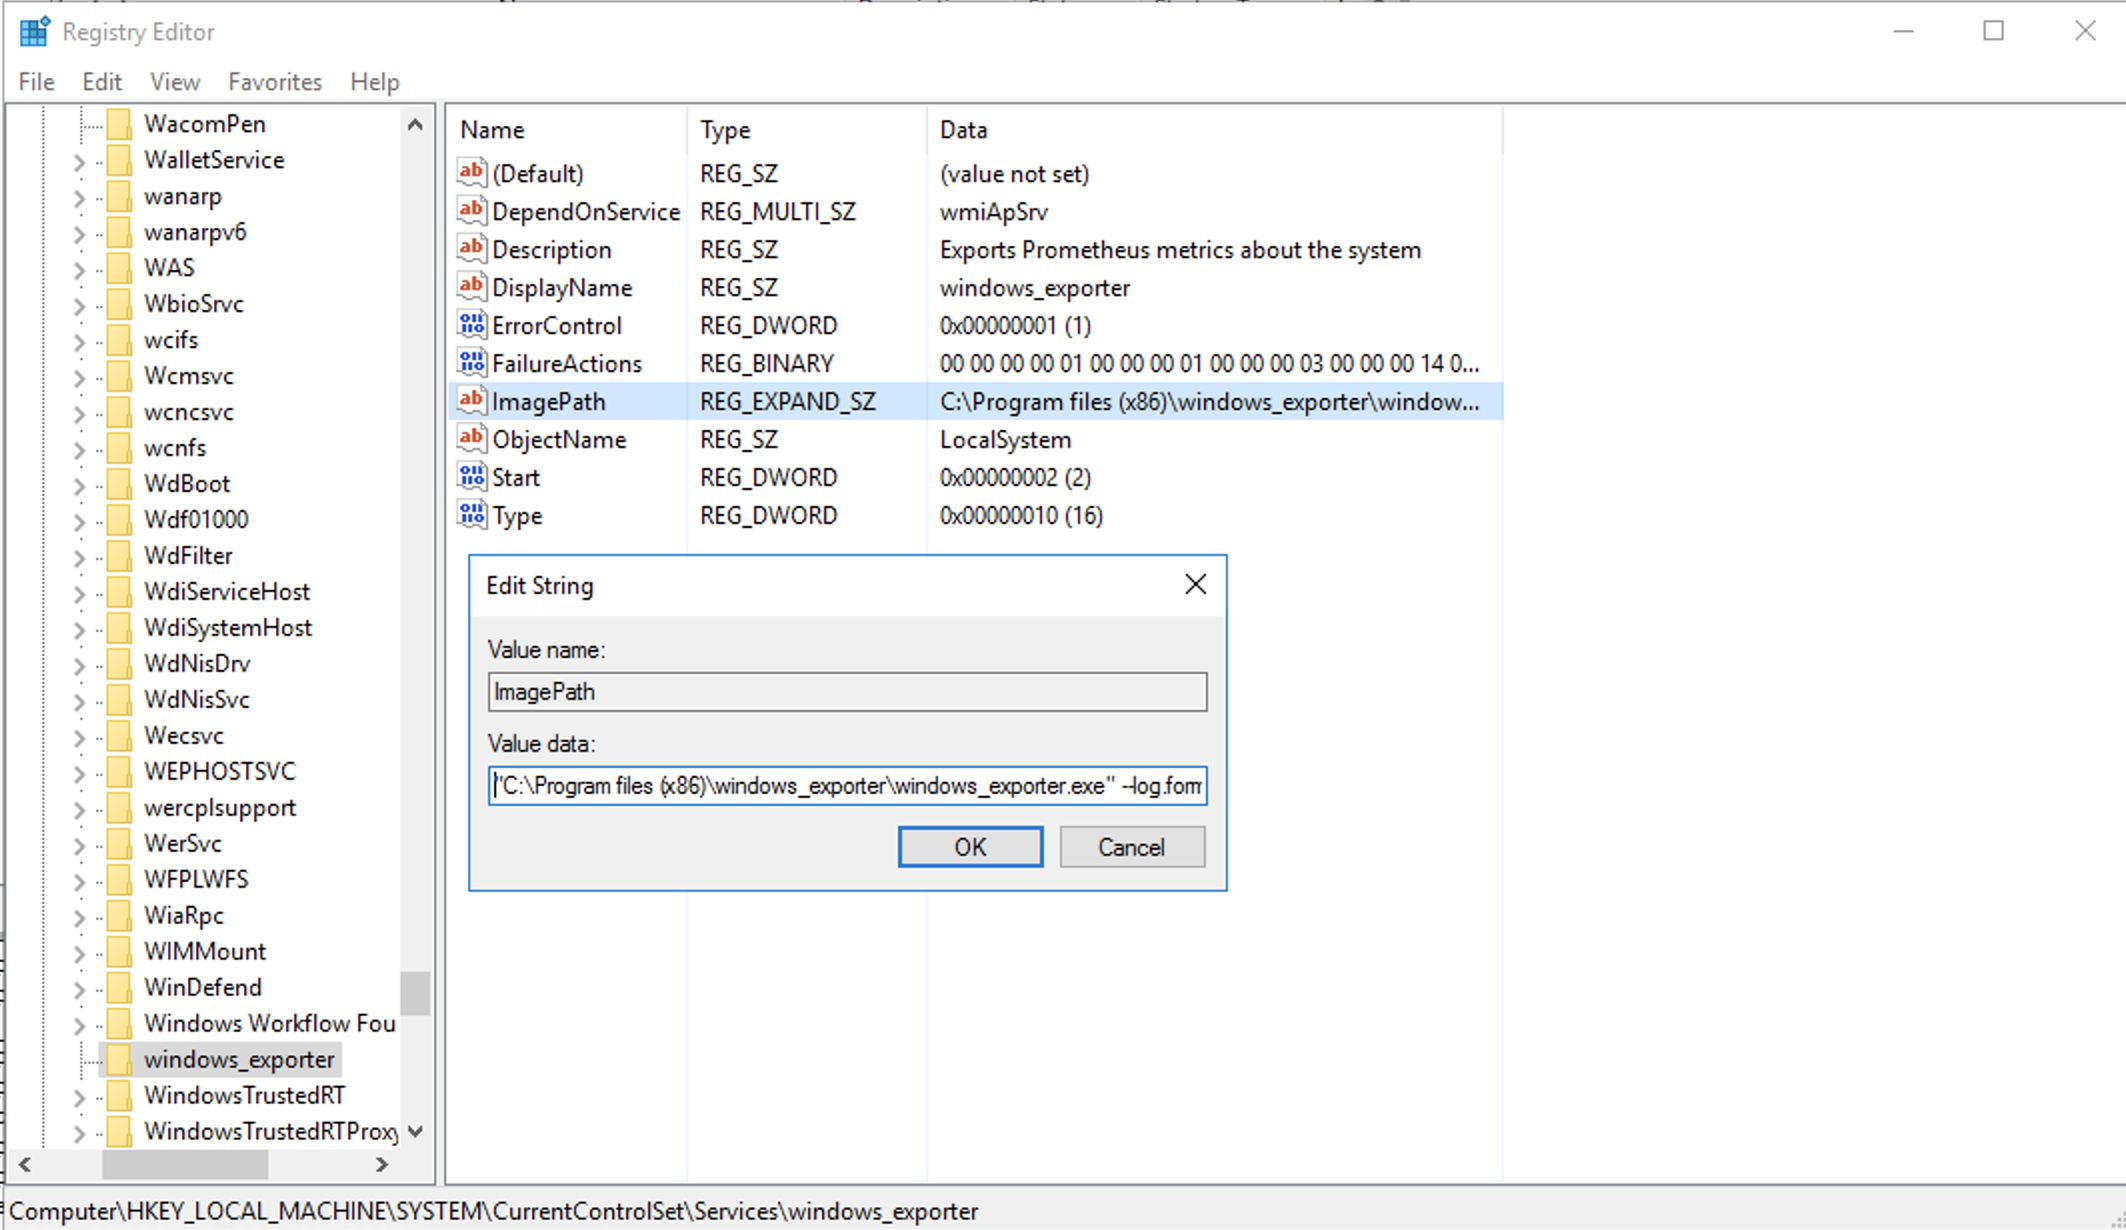
1. Enable through regedit
Win + R > regedit > HKEY_LOCAL_MACHINE > SYSTEM > CurrentControlSet > Services > Windows_exporter
Double click on “ImagePath” string to edit. Change it’s value and click ok.
C:\Program files (x86)\windows_exporter\windows_exporter.exe --log.format logger:eventlog?name=windows_exporter --collectors.enabled ad,dns,cs,cpu,logical_disk,memory,service,system,tcp --telemetry.addr :9182
Now restart windows_exporter service.
If you don’t want to follow process 1 then you can also enable collectors from process 2 which is through sc command. The Service Controller utility SC is a powerful command-line utility for managing Windows services.
2. Enable through SC Command
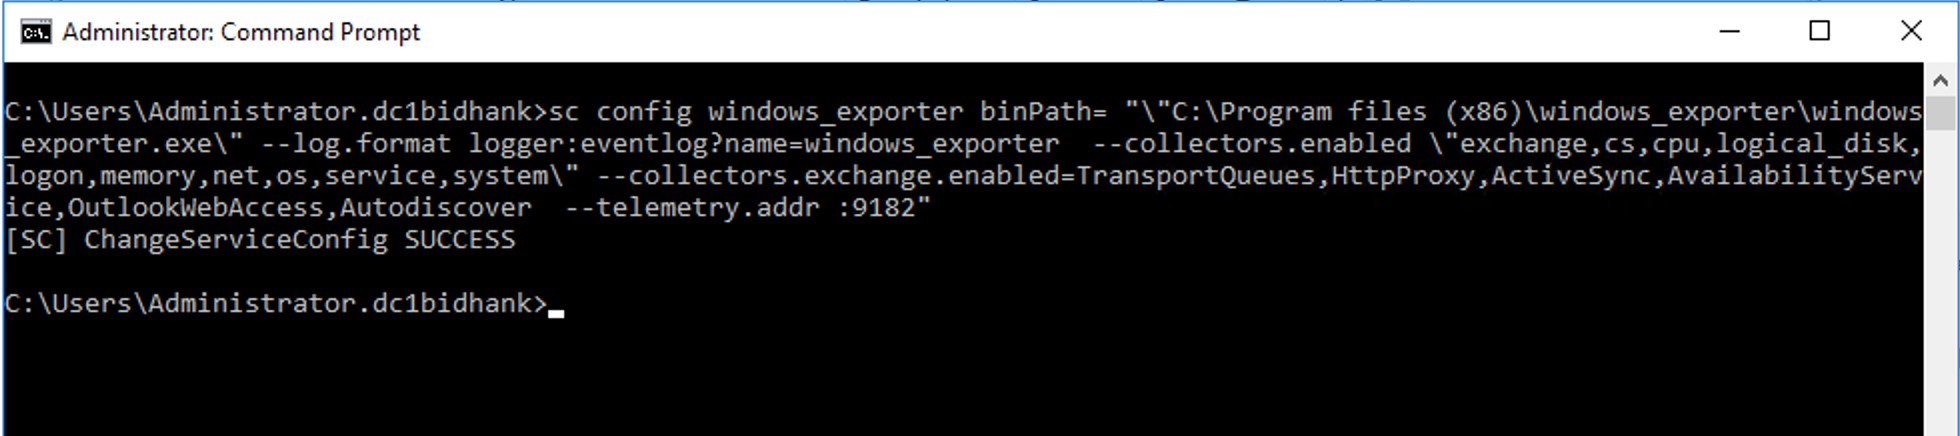
Open terminal and execute below command.
sc config windows_exporter binPath= "\"C:\Program files (x86)\windows_exporter\windows_exporter.exe\" --log.format logger:eventlog?name=windows_exporter --collectors.enabled \"ad,dns,cs,cpu,logical_disk,logon,memory,net,os,service,system,tcp\" --telemetry.addr :9182"
It’s output should be [SC] ChangeServiceConfig SUCCESS
 Now restart windows_exporter service. If your service doesn’t start after you execute sc command then check again for it’s windows exporter config. You might have missed something.
Enable Exchange Collector
You need to enable exchange collector and define –collectors.exchange flags too. The exchange collector collects metrics from MS Exchange hosts through perflib.
1. Enable through regedit
C:\Program files (x86)\windows_exporter\windows_exporter.exe --log.format logger:eventlog?name=windows_exporter --collectors.enabled "exchange,cpu,cs,logical_disk,logon,memory,net,os,system,tcp" --collectors.exchange.enabled=TransportQueues,HttpProxy,ActiveSync,AvailabilityService,OutlookWebAccess,Autodiscover
2. Enable through SC Command
sc config windows_exporter binPath= "\"C:\Program files (x86)\windows_exporter\windows_exporter.exe\" --log.format logger:eventlog?name=windows_exporter --collectors.enabled \"exchange,cs,cpu,logical_disk,logon,memory,net,os,service,system,tcp\" --collectors.exchange.enabled=TransportQueues,HttpProxy,ActiveSync,AvailabilityService,OutlookWebAccess,Autodiscover --telemetry.addr :9182"
 Now restart windows_exporter service. If your service doesn’t start then please check above command again.
Prometheus
I hope you have already installed Prometheus. If not then you should first install it and it should be running. Windows Metrics are exposed through windows exporter and now Prometheus needs to scrape those metrics. so for that, we have to configure our Windows Machines in Prometheus target.
vim /etc/prometheus/prometheus.yml
  - job_name: win-exporter
    scrape_interval: 15s
    scrape_timeout: 6s
    static_configs:
    - targets: ['win-srv-01:9182', 'win-srv-02:9182']
systemctl restart prometheus
systemctl status prometheus
Above settings will scrape for metrics in every 15sec interval. If it takes longer than 6s to scrape then it will go in timeout. If remote windows server generates lots of metrics then you may need to increase your scrape_timeout time too.
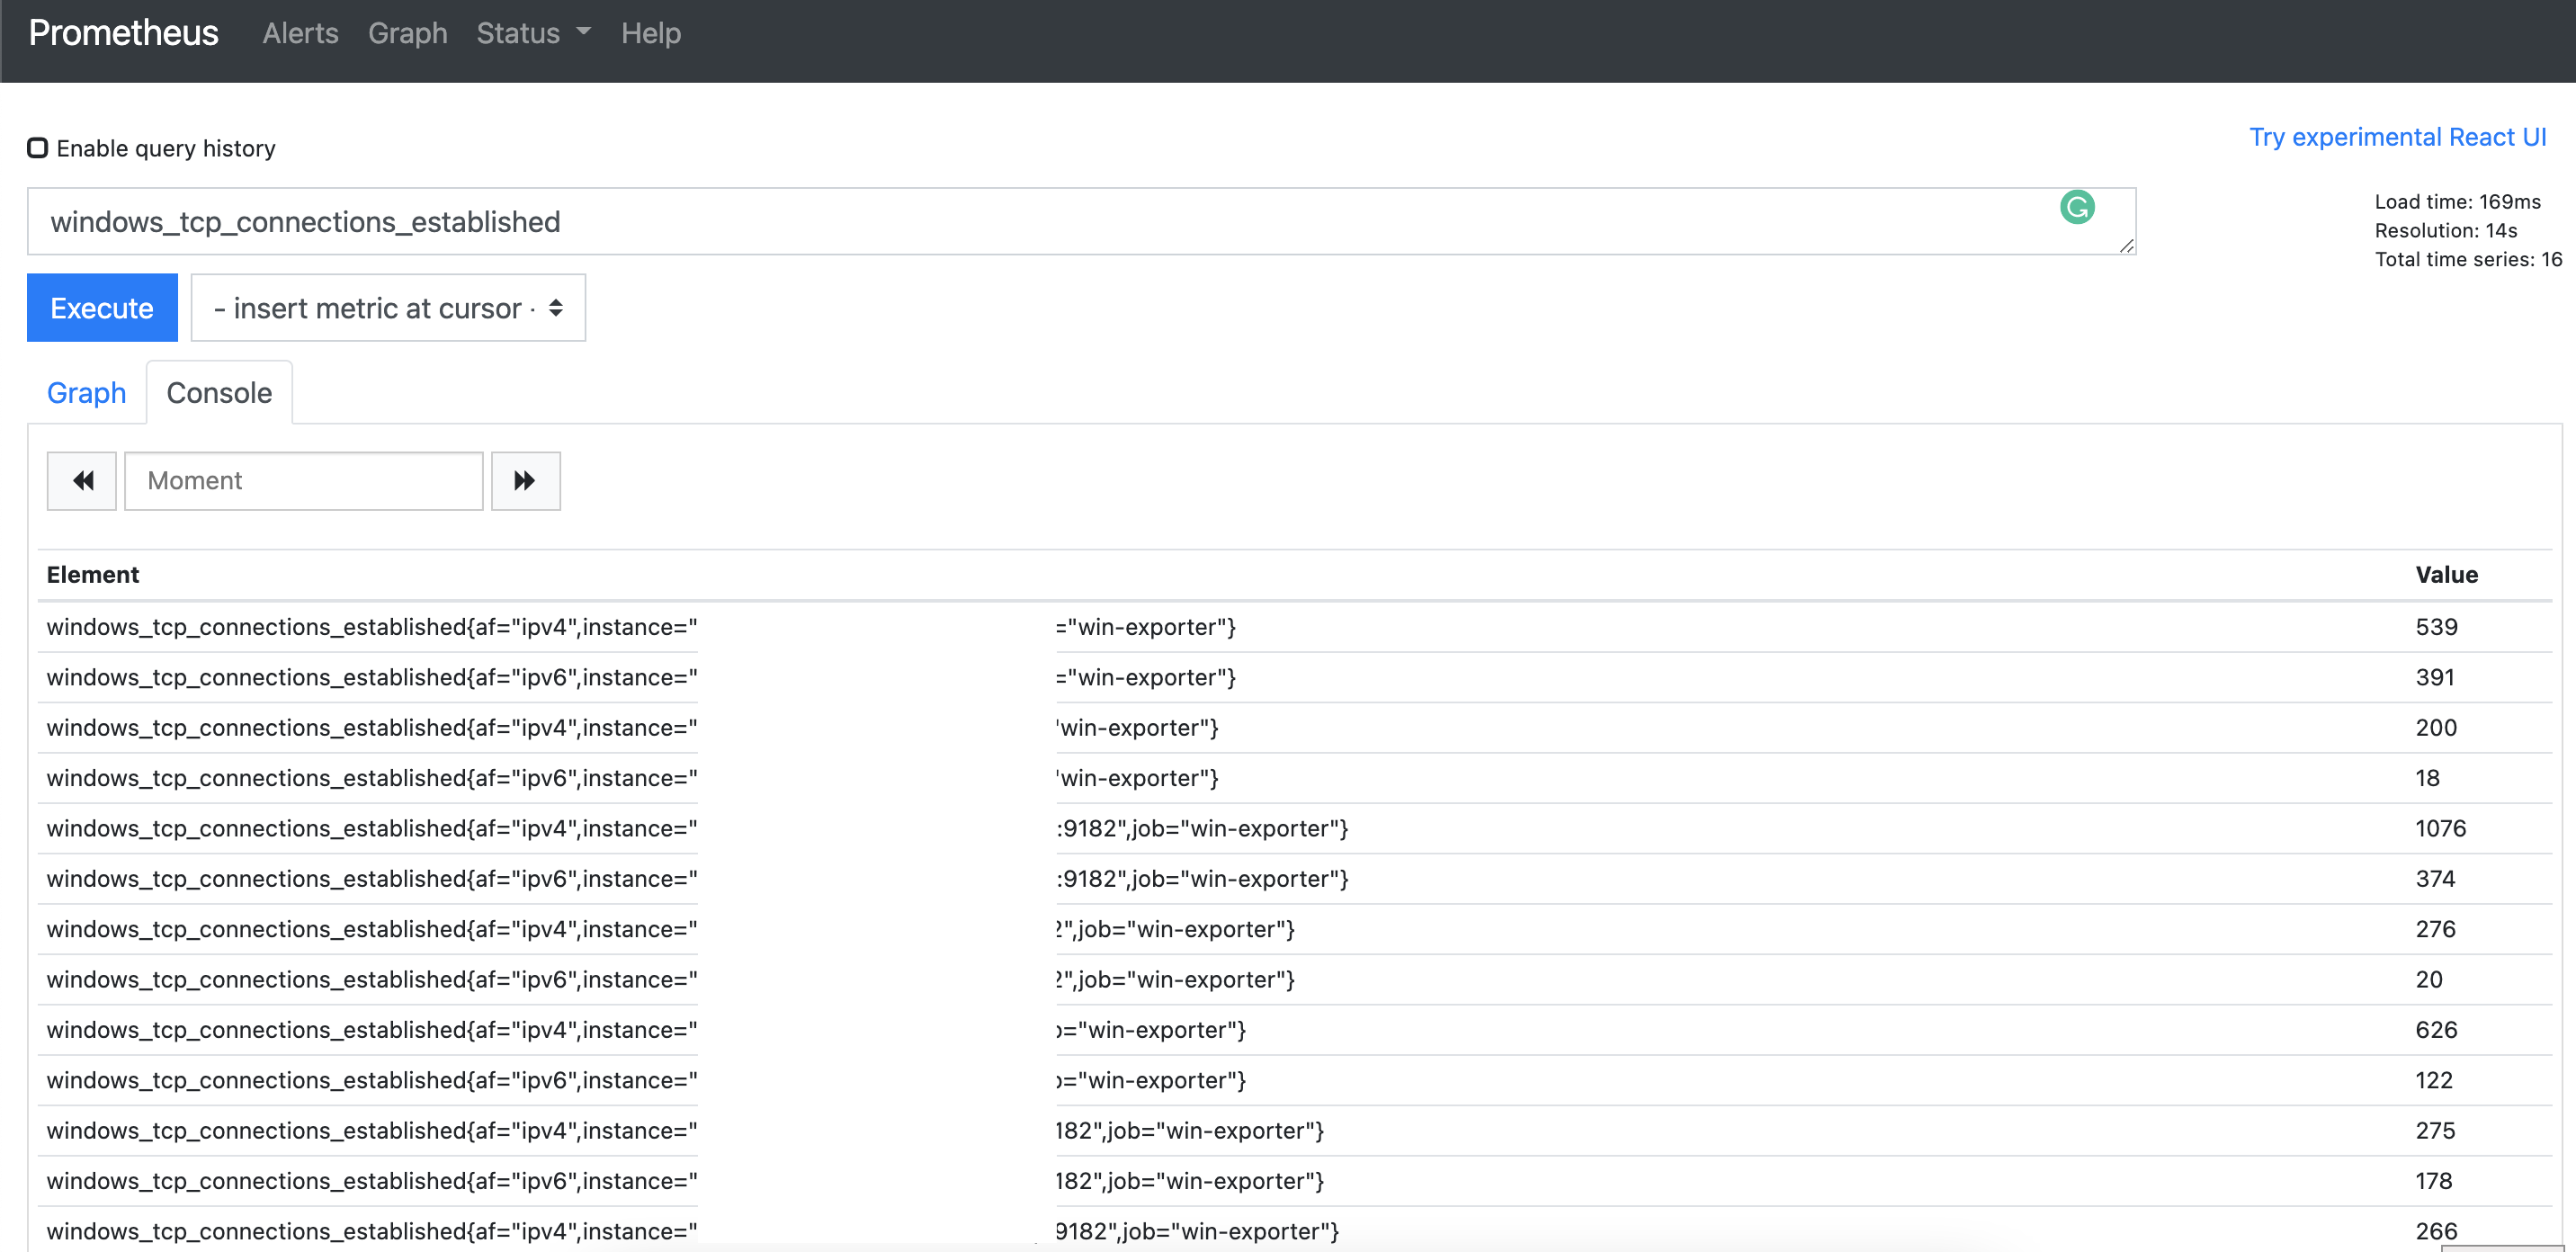
Now access your prometheus UI through browser. and select the “Status” tab and click on Targets to make sure that Prometheus is correctly connected to the job name “win-exporter”.
Also check for windows metrics in prometheus UI.
Grafana Dashboard
I guess you have already installed grafana. In Grafana, you can either create your own dashboards or you can use pre-existing ones that contributors already crafted for you. I am going to Import Windows Node Dashboard ID 2129 and Prometheus - AD and DNS Dashboard ID 3969. and for Exchange, I will create my own dashboard.
To Import Dashboard. Click + in grafana. and click Import. Place your Dashboard ID or URL and click Load.
Another option to load dashboard is by uploding .json file.
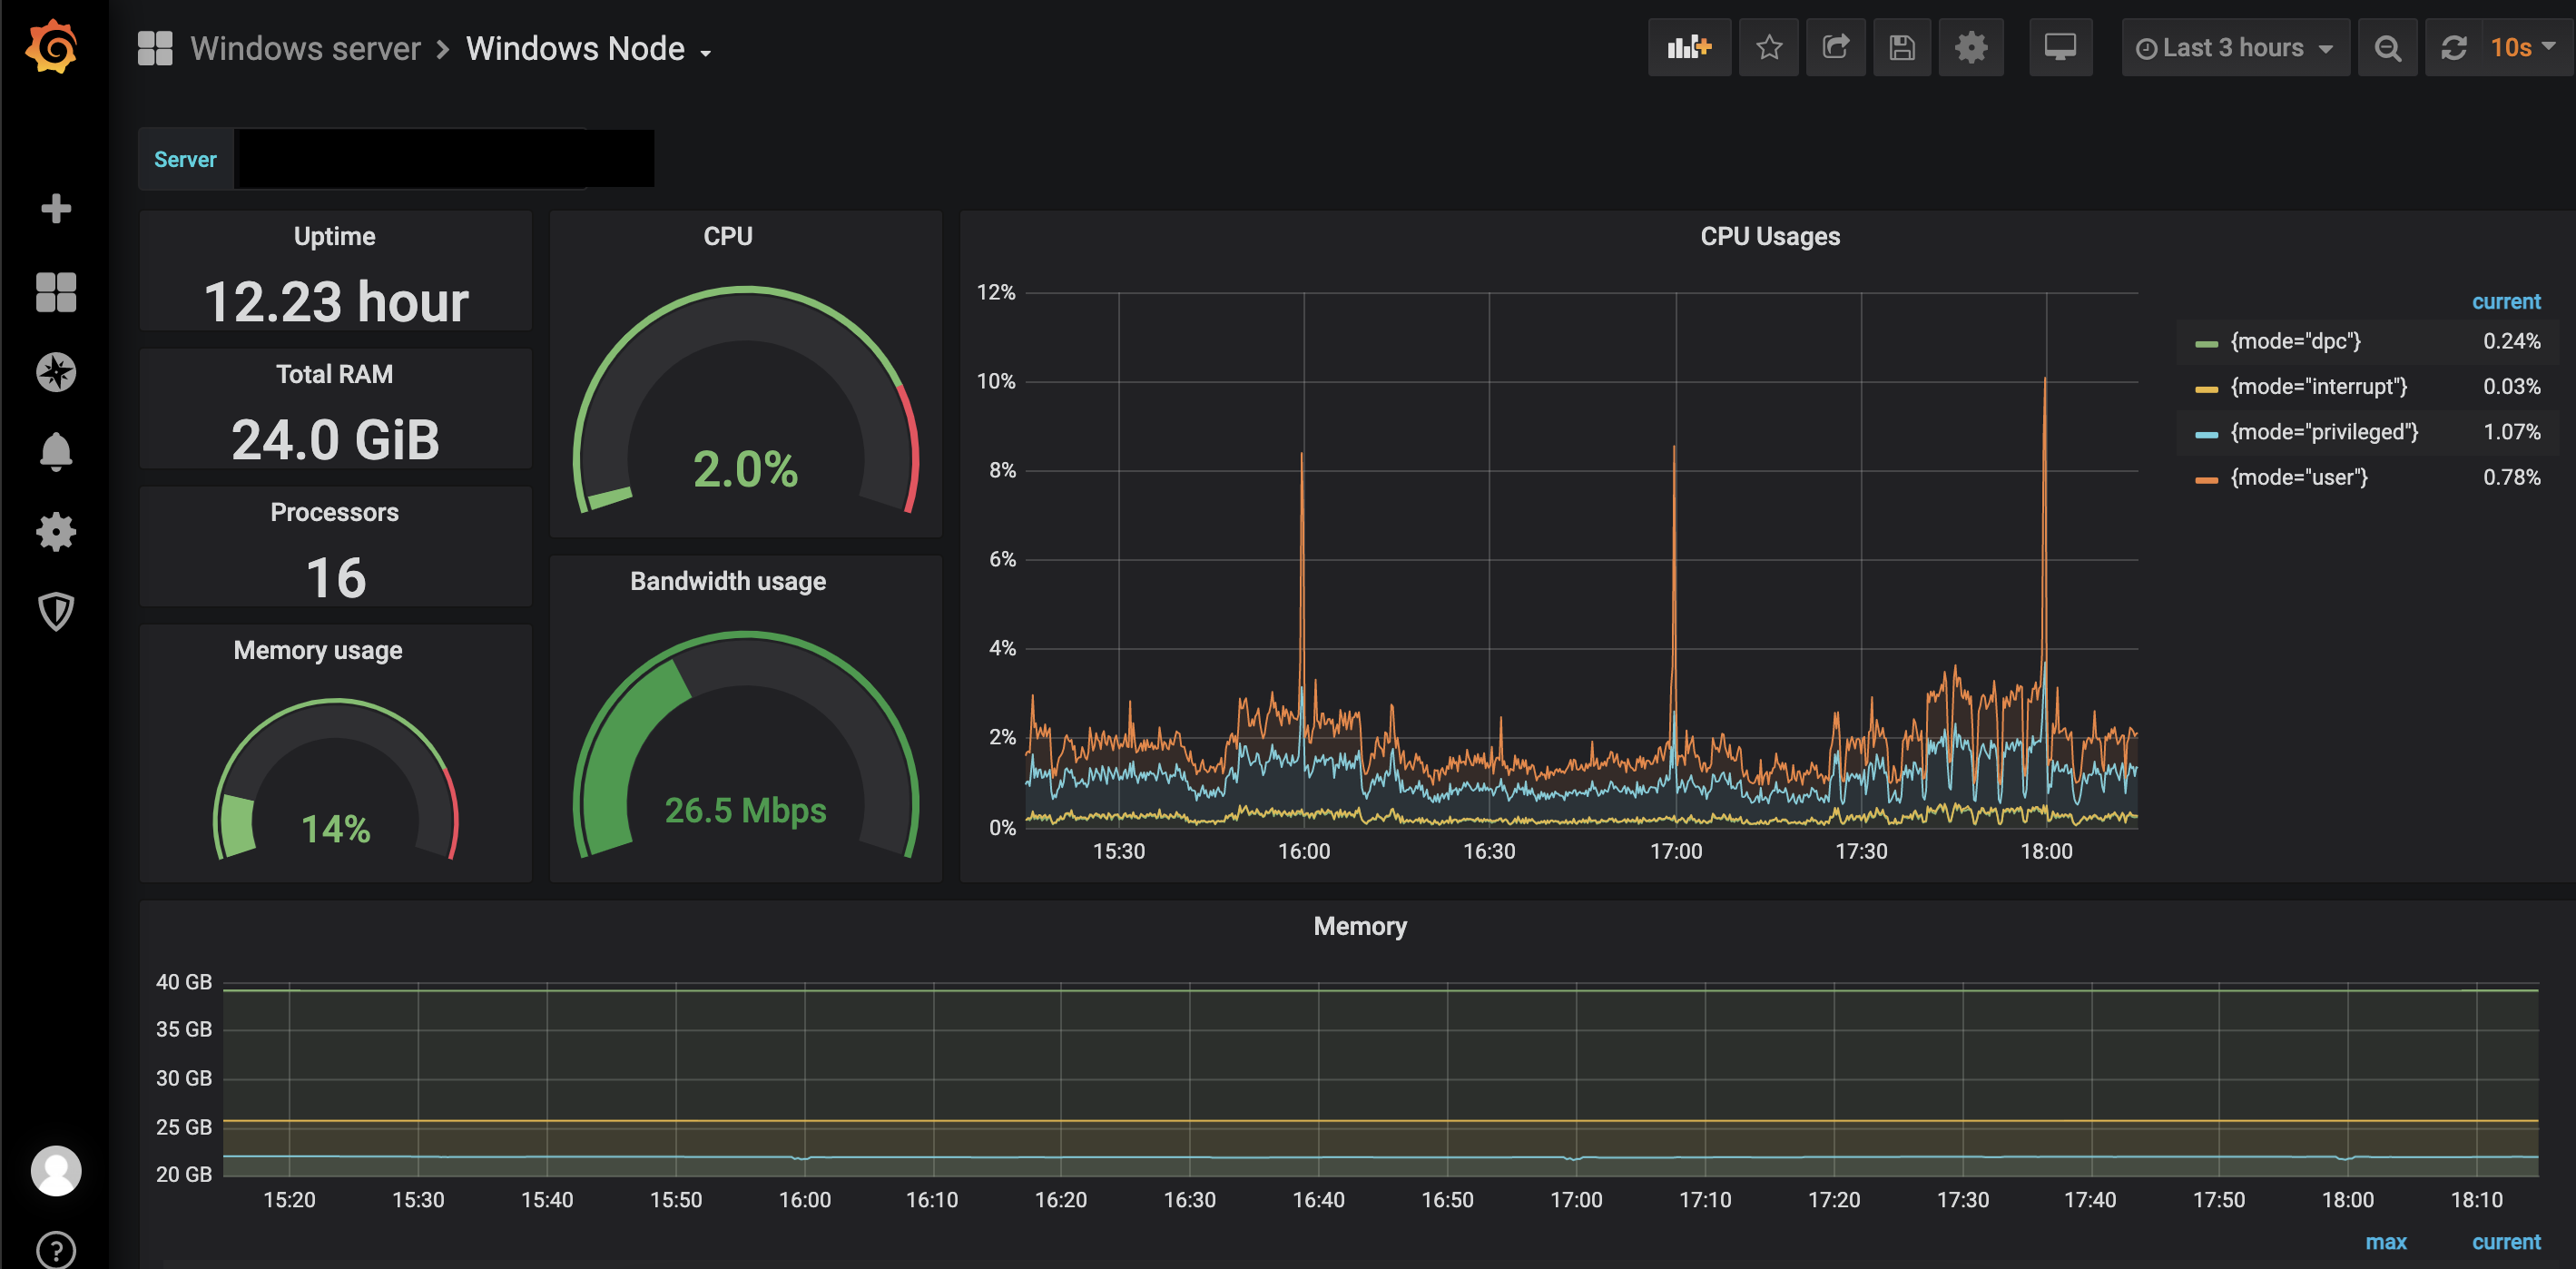
To import windows grafana dashboard.
In our case, we are going to use the Windows Node dashboard, accessible via the 2129 ID.
https://grafana.com/grafana/dashboards/2129
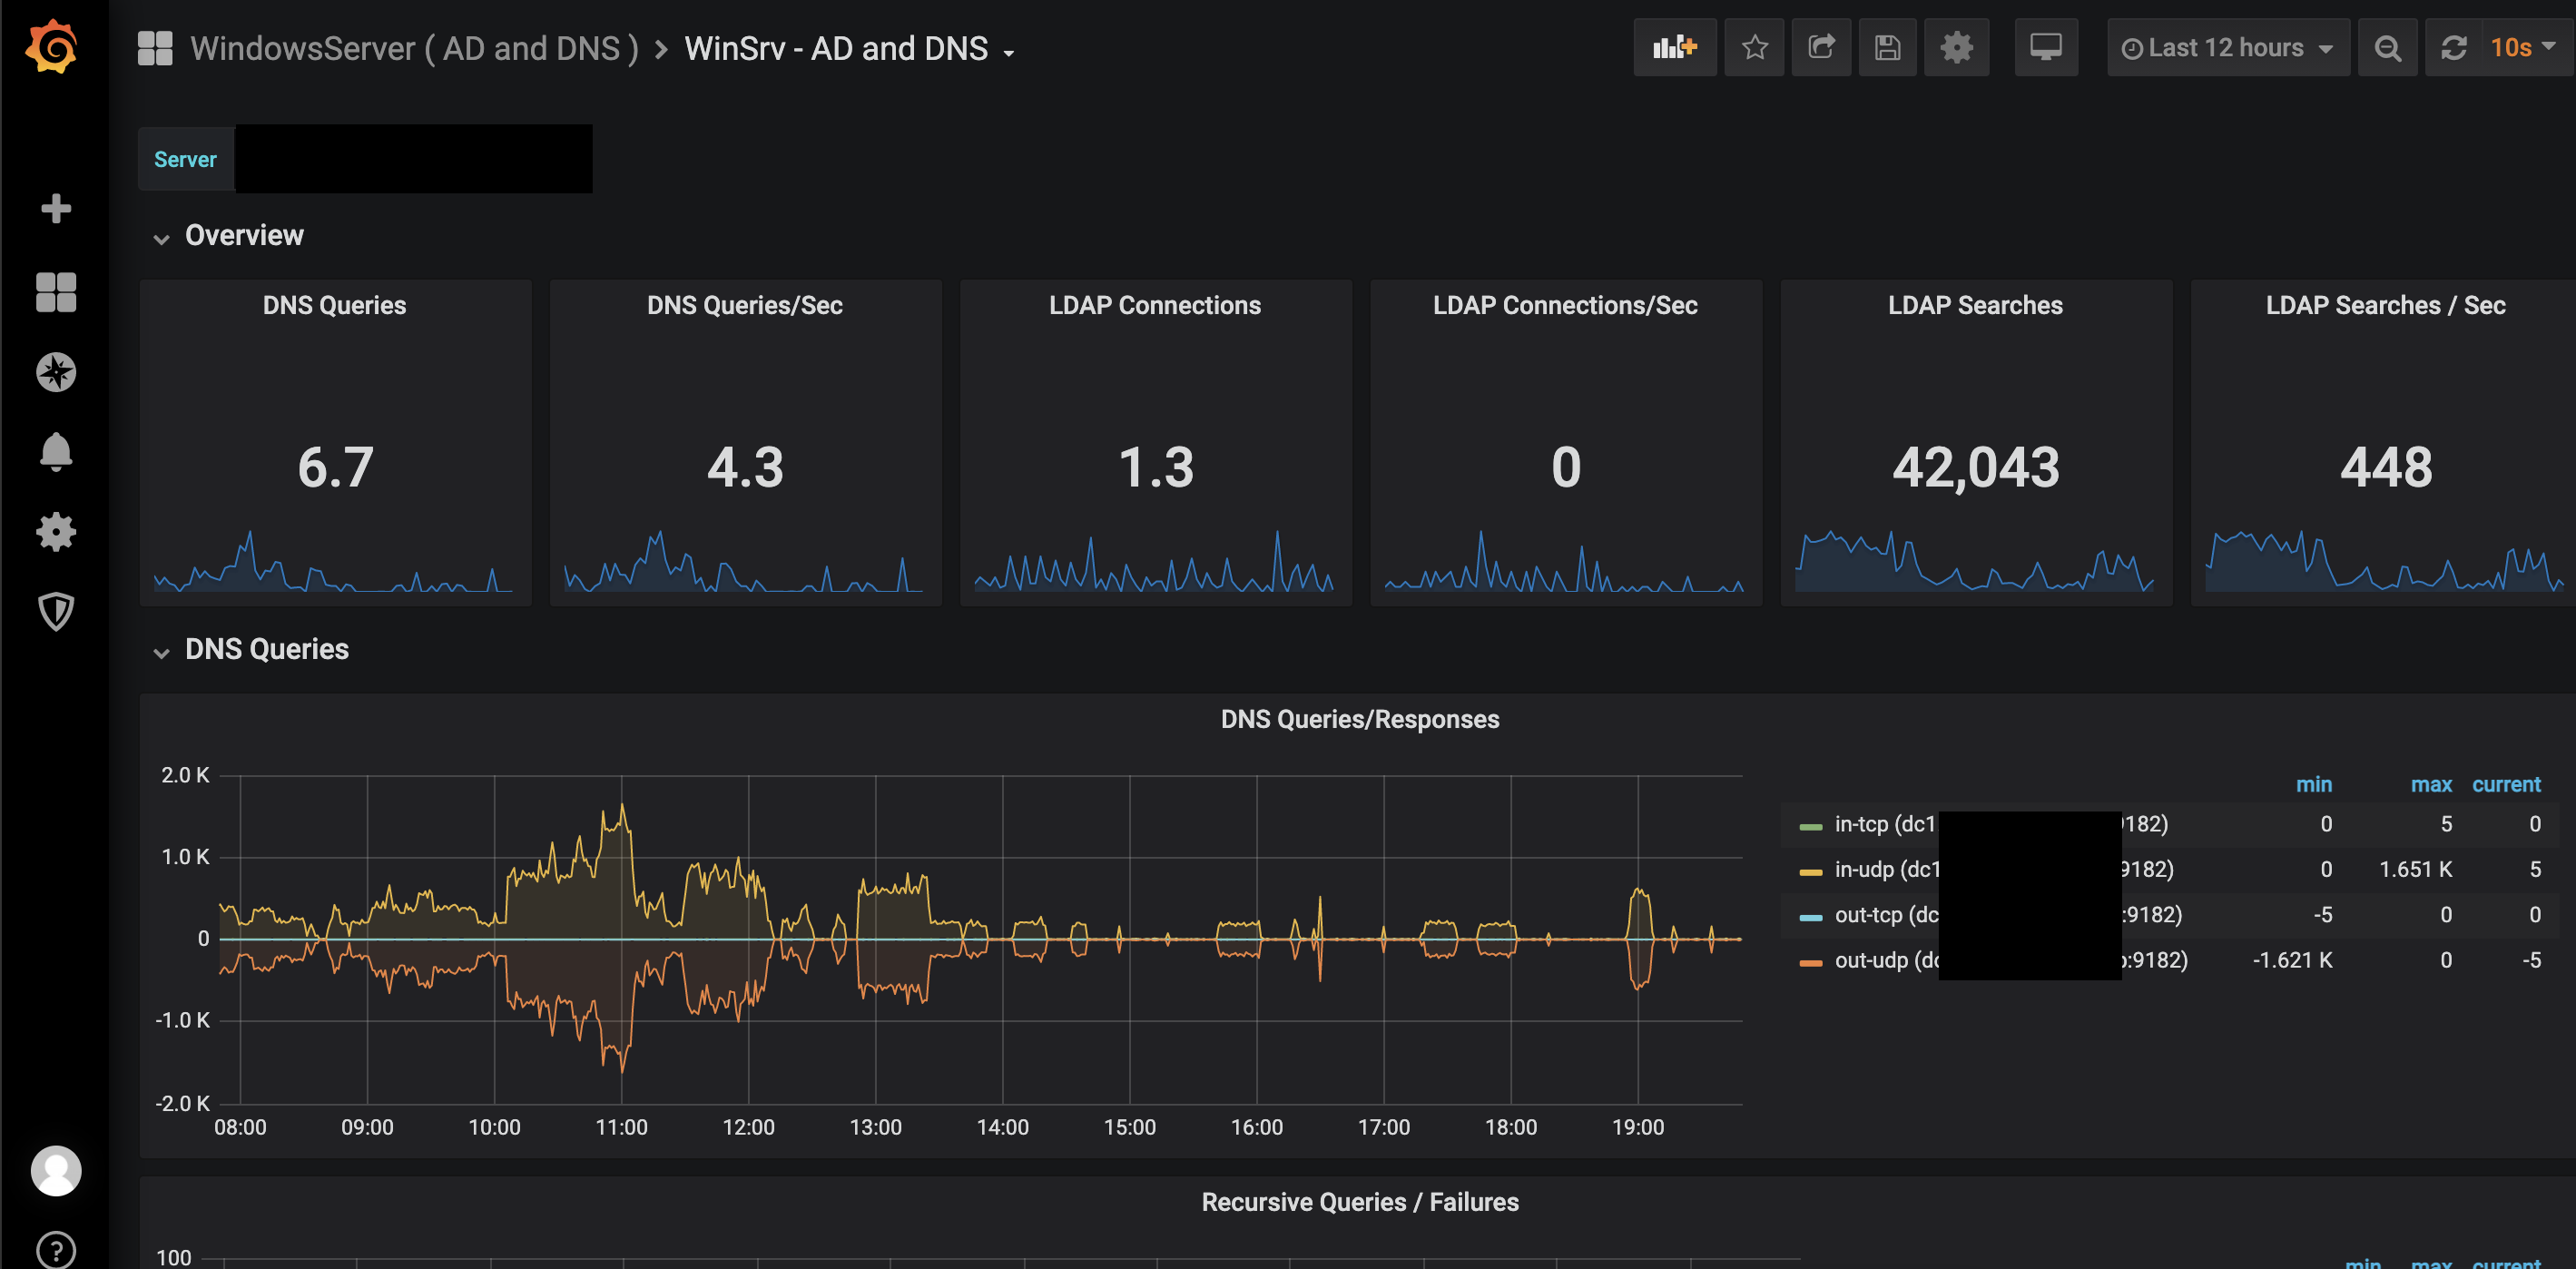
For AD, DNS Dashboard, use 3969 ID.
https://grafana.com/grafana/dashboards/3969
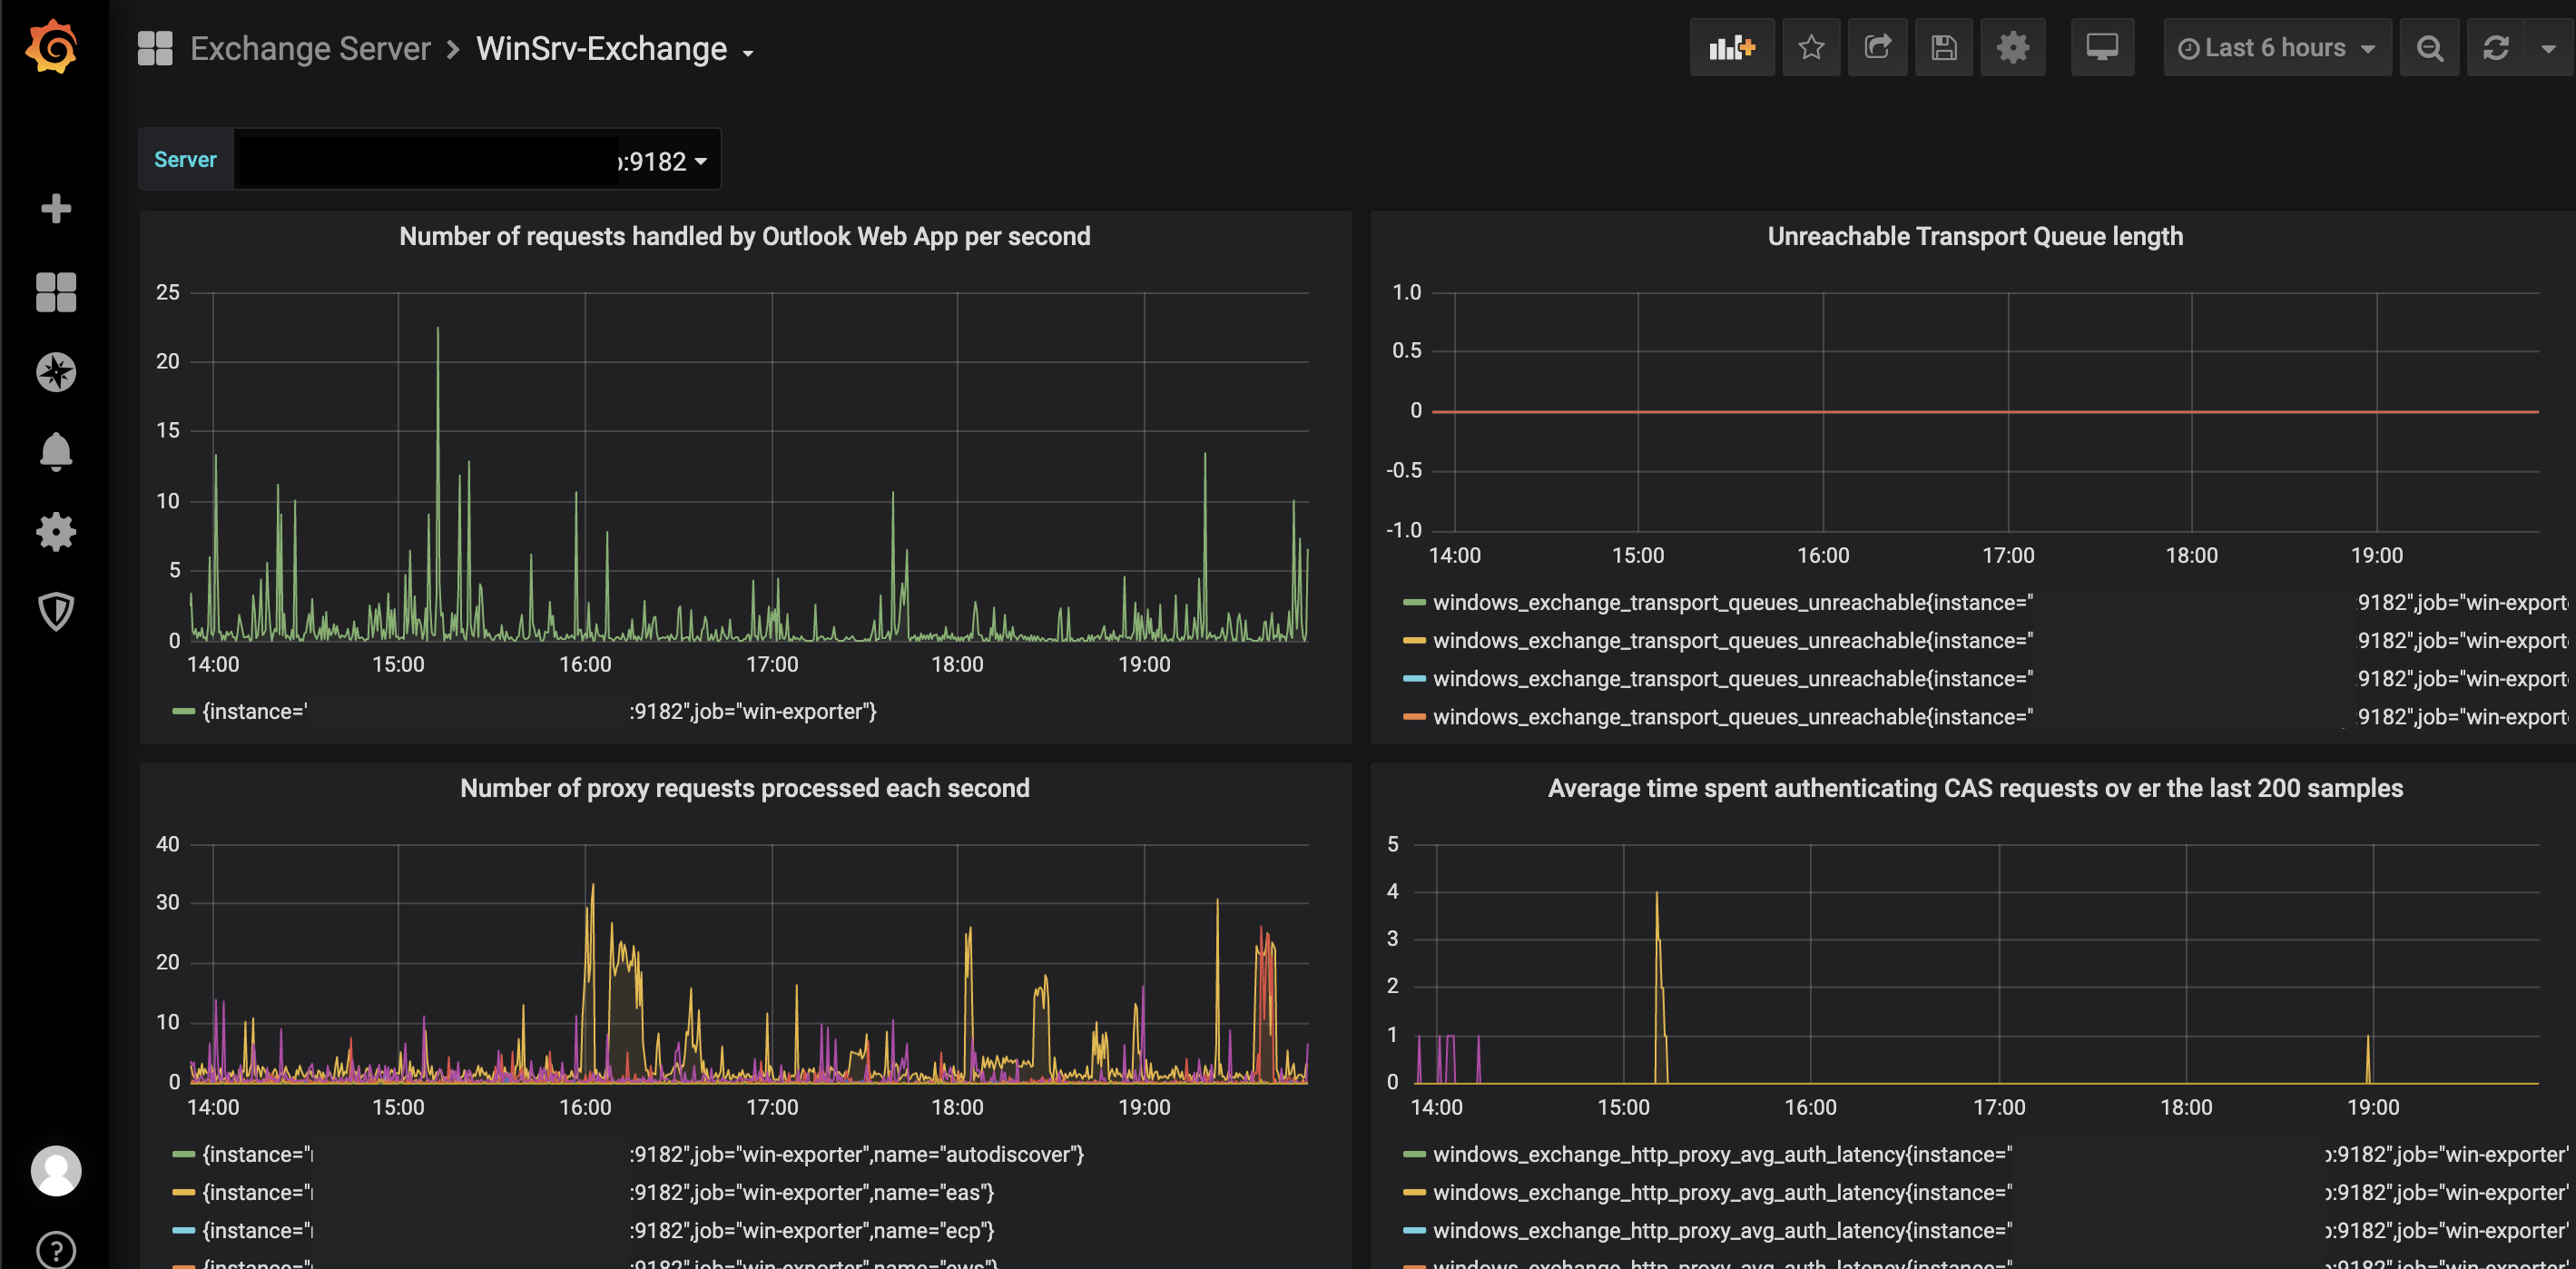
For exchange, I created my own Grafana Dashboard. After you collect all exchange metrics, you can work in visualization part.
And for Alerting part, either you can use Grafana Alert system or use AlertManager of Prometheus. They have their own pros and cons so choose accordingly your need. I suggest you to use AlertManager.


Leave a comment