Monitor HA Cluster running Pacemaker and Corosync using Prometheus and Grafana using Docker
Updated:
We will use Grafana with prometheus in container to monitor High availability cluster running by Pacemaker and Corosync.
Grafana dashboard which we will be using shows the details of a HA cluster running Pacemaker/Corosync. It is built on top of ha_cluster_exporter but it also requires Prometheus node_exporter to be configured on the target nodes, and it also assumes that the target nodes in each cluster are grouped via the job label.
INSTALL HA_CLUSTER_EXPORTER
mkdir /usr/local/ha_cluster_exporter
cd /usr/local/ha_cluster_exporter
wget https://github.com/ClusterLabs/ha_cluster_exporter/releases/download/1.3.3/ha_cluster_exporter-amd64.gz
gunzip ha_cluster_exporter-amd64.gz
mv ha_cluster_exporter-amd64 ha_cluster_exporter
chmmod +x ha_cluster_exporter
Create systemd file.
vim /etc/systemd/system/ha_cluster_exporter.service
[Unit]
Description=HA Cluster Exporter

[Service]
User=root
WorkingDirectory=/usr/local/ha_cluster_exporter
ExecStart=/usr/local/ha_cluster_exporter/ha_cluster_exporter
Restart=always

[Install]
WantedBy=multi-user.target
Start and enable service.
systemctl enable --now ha_cluster_expoter
INSTALL NODE_EXPORTER
wget https://github.com/prometheus/node_exporter/releases/download/v1.6.1/node_exporter-1.6.1.linux-amd64.tar.gz
tar xvf node_exporter-1.6.1.linux-amd64.tar.gz
mv node_exporter-1.6.1.linux-amd64.tar.gz node_exporter
mv node_exporter /usr/local/
cd /usr/local
mv node_exporter-1.6.1.linux-amd64 node_exporter
vim /etc/systemd/system/node_exporter.service
[Unit]
Description=Prometheus Node Exporter

[Service]
User=root
WorkingDirectory=/usr/local/node_exporter
ExecStart=/usr/local/node_exporter/node_exporter --collector.systemd --collector.systemd.unit-include="pcsd|pacemaker|corosync)".service
Restart=always

[Install]
WantedBy=multi-user.target
systemctl enable --now node_exporter
Now Build Prometheus and Grafana Container
For the persistent container storage, execute below commands.
mkdir /var/Docker_home
cd /var/Docker_home
mkdir Prometheus Grafana
mkdir /Prometheus/PromDB
mkdir /Grafana/data
chmod 777 /prometheus/PromDB
chmod 777 /Grafana/data
Create Docker Compose file.
vim docker-compose.yml
version: '3'
services:
  prometheus:
    image: prom/prometheus
    container_name: prometheus
    ports:
      - 9090:9090
    volumes:
      - ./Prometheus/prometheus.yml:/etc/prometheus/prometheus.yml
      - ./Prometheus/PromDB:/prometheus

  grafana:
    image: grafana/grafana-oss
    container_name: grafana
    ports:
      - 3000:3000
    volumes:
      - ./Grafana/data:/var/lib/grafana
The code defines Docker services: Prometheus for monitoring (port 9090, config and data persistence), and Grafana for visualization (port 3000, data persistence). Docker volumes ensure host-container data sharing, allowing configuration and data to be stored persistently across restarts in respective directories.
Create prometheus config file.
vim /var/Docker_home/Prometheus/prometheus.yml
global:
  scrape_interval:     10s
  evaluation_interval: 10s

scrape_configs:
  - job_name: "ha-cluster"
    static_configs:
      - targets: ['ram-01.bidhankhatri.com.np:9664', 'ram-02.bidhankhatri.com.np:9664', 'ram-01.bidhankhatri.com.np:9100', 'ram-02.bidhankhatri.com.np:9100']
Port 9664 for ha_cluster_exporter and Port 9100 for node_exporter
docker-compose up -d
Pulling prometheus (prom/prometheus:)...
latest: Pulling from prom/prometheus
d5c4df21b127: Pull complete
2f5f7d8898a1: Pull complete
300c29bb5b04: Pull complete
be6ad5a51a35: Pull complete
ea6cf9f81dfe: Pull complete
b5ac85a4be54: Pull complete
d32980b63d51: Pull complete
502ed6d3bdc8: Pull complete
7bed70210741: Pull complete
3b19398e1689: Pull complete
d358eb0a0392: Pull complete
d6eaeaf54563: Pull complete
Digest: sha256:d6ead9daf2355b9923479e24d7e93f246253ee6a5eb18a61b0f607219f341a80
Status: Downloaded newer image for prom/prometheus:latest
Pulling grafana (grafana/grafana-oss:)...
latest: Pulling from grafana/grafana-oss
4db1b89c0bd1: Pull complete
312681f4cad0: Pull complete
8b7b65888846: Pull complete
dd9c3d04d541: Pull complete
959325519a8e: Pull complete
16cb2df7bffd: Pull complete
94d1f5f5bfea: Pull complete
e3281a1a7e8f: Pull complete
5c0c2b741753: Pull complete
Digest: sha256:423040d62678074111e4e72d7dcef23480a94eb4f21b9173204d1a5ee972ec59
Status: Downloaded newer image for grafana/grafana-oss:latest
Creating prometheus ... done
Creating grafana    ... done
docker ps
CONTAINER ID   IMAGE                 COMMAND                  CREATED         STATUS              PORTS                                       NAMES
1fb48738a930   prom/prometheus       "/bin/prometheus --c…"   2 minutes ago   Up About a minute   0.0.0.0:9090->9090/tcp, :::9090->9090/tcp   prometheus
f5362d262246   grafana/grafana-oss   "/run.sh"                2 minutes ago   Up About a minute   0.0.0.0:3000->3000/tcp, :::3000->3000/tcp   grafana
Both Grafana and Prometheus are up now.
CONFIGURE GRAFANA
Go to http://YOURIPADDRESS:3000 to access grafana UI. Default username/password is admin/admin. change it after login.
-
1st connect Grafana to Prometheus:
Home » Connections » Add new connection » Search for Prometheus » Create a Prometheus data source » update prometheus server URL: http://YOURIPADDRESS:9090
Click on Save & Test -
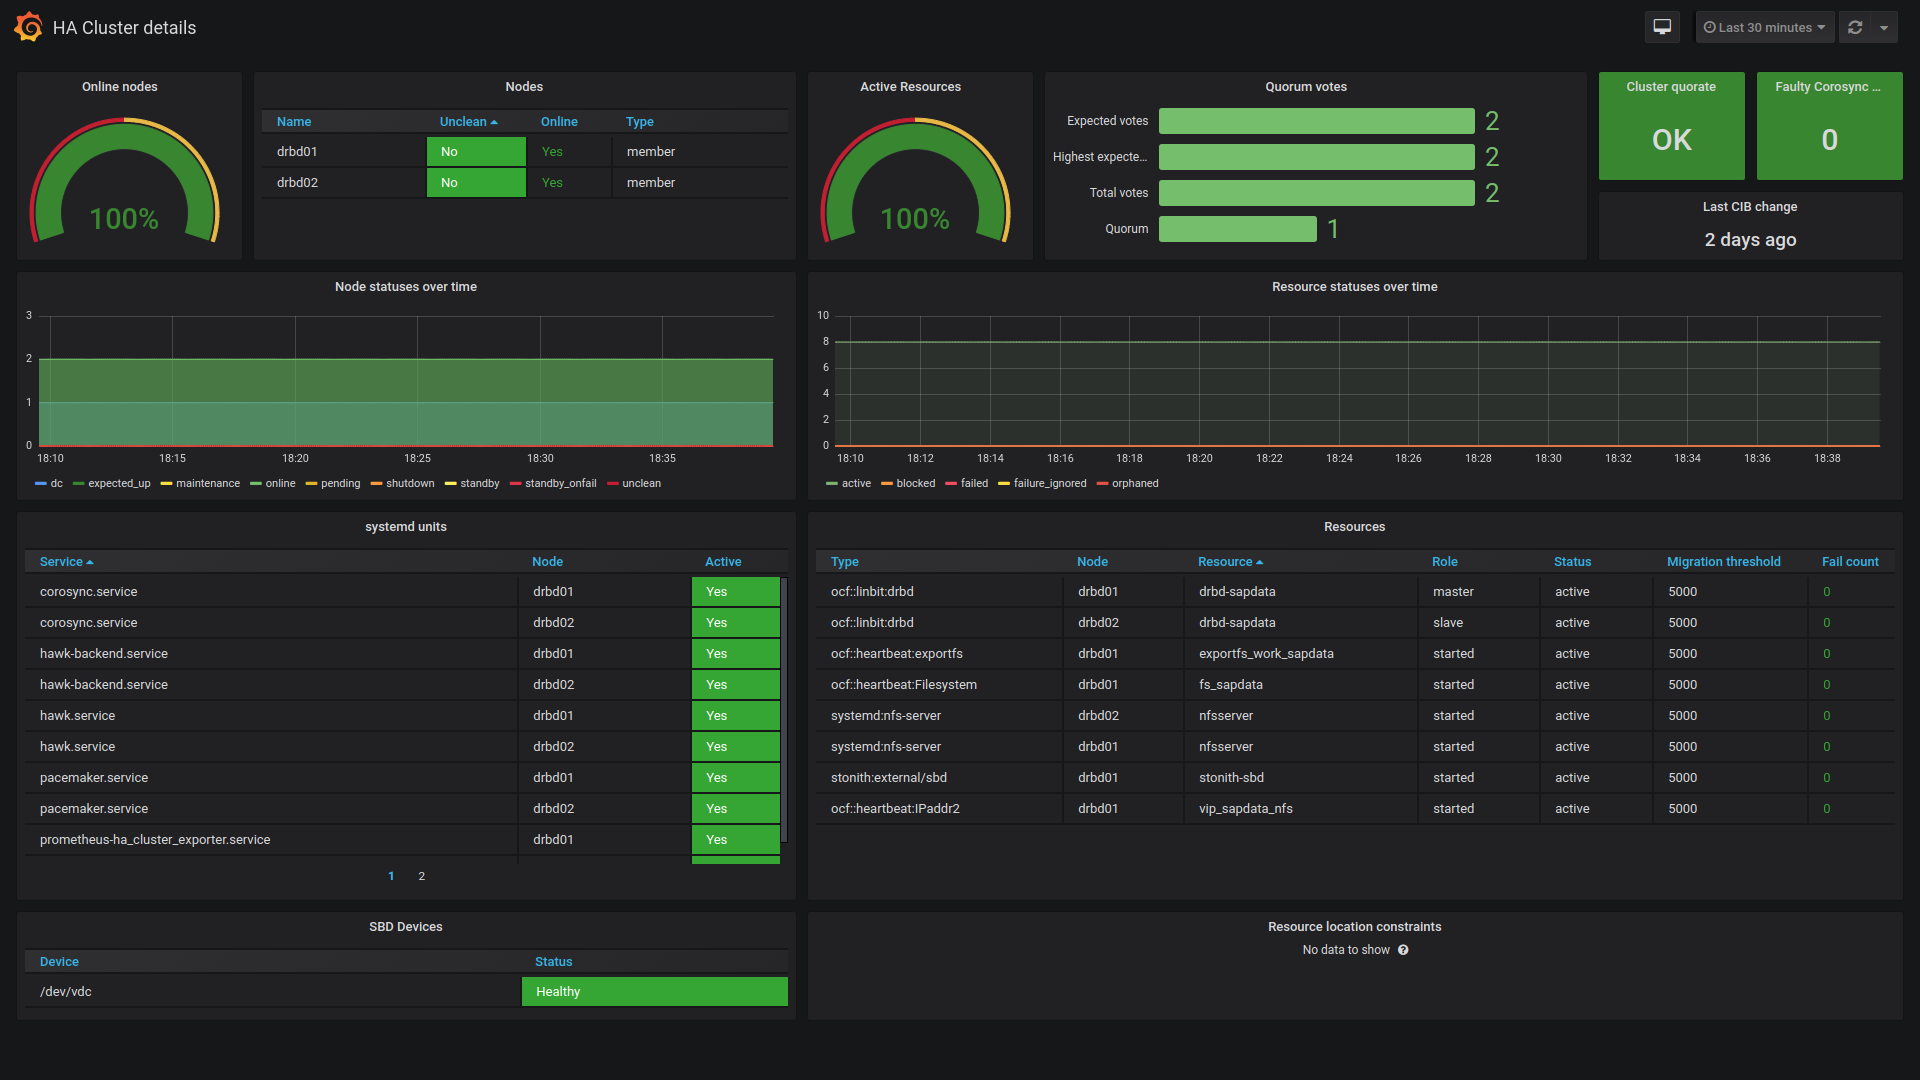
Second, Import Grafana Dashboard for HA cluster. Ref: https://grafana.com/grafana/dashboards/12229-ha-cluster-details/
Home » Dashboard » New [ drop down] » Import » Put ID 12229 and click on Load » Choose prometheus which we configured earlier
Click on Import
Similar graph you will see.


Leave a comment